Download
1 / 18
180 likes | 199 Vues
Investigating bias-dependent shifts in cluster centroids of the LHCb VELO detector sensors. Observations suggest possible ballistic deficit and misalignment, challenging existing theories. Explore the implications and seek solutions for this anomaly.

E N D
Observations of anomalous(?) bias dependent cluster centroid shifts in the LHCb VELO detector. Aras PapadelisNIKHEF Vertex 2005, Nikko, Japan
Outline • Silicon sensors for the LHCb VErtex LOcator. • Sensors and FE electronics. • Silicon specs. • Beam test results • Motivation • Observed bias dependency of reconstructed cluster position. • Observation of possible ballistic deficit in VELO. • Anomalous centroid shifts.
42mm 7mm The sensors in the VELO detector Quick reminder(for more details, see talk of L.Eklund ) • R and measuring sensors, 2048 strips per sensor • Analogue FE read out done by the Beetle chip. • 25 ns peaking time • 128 strips read out in parallel.
Some silicon specifications VELO sensor is of ”normal” design, no surprises are expected. Drift times well below 25 ns.
Background • Sept 2004: Steve Biagi (LHCb Liverpool) suggests that ballistic deficit in non-irradiated sensors can give offsets in reconstructed cluster position for angled tracks. • Subsequently investigated in VELO beam tests of Nov 2004.
sensor beam 10° incidence angle Test beam setup CERN X7 SPS 120GeV pions. Beam Took data at 10°, bias voltages 100V, 200V and 300V. (Vfd is 34V and 55 V) Hamamatsu R sensor (Telescope) Hamamatsu Phi sensor (Telescope) PR04 200 micron R sensor PR04 300 micron R sensor
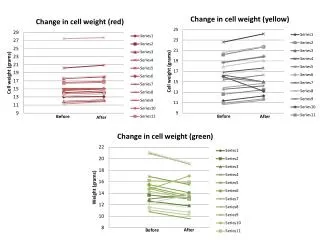
Bias dependent mean residual shift • We are looking for a shift in the mean value of the track residual distribution. • Align system at 100V • Study mean residual at different bias voltages. 300 µm 200 µm 100 V 200 V 300 V Residual (cm) Residual (cm)
Residual shift vs radius 200 µm 300 µm 9m 8m • Clear systematic shift in residuals between different voltages. Same size for both 200 and 300 µm thick sensors. (Effect first observed by J. Palacios, CERN) • ”Banana bend” for 200µm at high pitch, possibly due to warped sensor. • Looks like sensors are misaligned! pitch
Further checks... • Widths of residual distribution more or less independent of bias voltage. • -distributions look as expected for a misaligned detector. 300 µm 200 µm
Safety check • Data taking was done in one sequence during 10 hours. 200 µm 300 µm Time VERY CLEAR: No time dependence big enough to cause misalignment
R300 R200 Ballistic deficit? • Signal increases between 100V and 300V. • Is this ballistic deficit? Also: • 300V arrives about 2 ns before 100 V. R200
Study of the performance of ATLAS prototype detectors using analogue front end electronics.(Riedler, Dabrowski, Kaplon, Weilhammer) • NIM A 477 (2002) 104–109 Unirradiated p-on-n • ”Similar” unirr. sensor (thickness, strip pitch, Vfd ) and FE electronics. • Result: Small ballistic deficit for sensor bias above 100V is observed. Publications on ballistic deficit • Charge collection efficiency studies with irradiated silicon detectors. (Allport et al.) • NIM A 501 (2003) 146-152 Similar results, the ballistic deficit at 100 V is small.
Signal loss due to timing • *Simplified* way of viewing ballistic deficit. Assume: • no charge trapping (unirradiated) • homegenous E-field • same µ everywhere in sensor. • Electrons in the grey region do not contribute fully to the signal. shift in the cluster centroid! For a 300 m sensor, a 8 m shift corresponds to a ~30 % signal loss between 300V and 100V. This is not what we observe! • Sensor thickness dependence should be seen! • Simulation needed! Cluster centroid shift n+ w n-bulk p+ 300V 100V NB: Proportions are not correct!
So, whodunnit? • Slowly moving sensors? NO! • Sensor movement due to change in voltage? VERY UNLIKELY! • Ballistic deficit? NO! • Unclear if the signal loss that can be observed is ballistic deficit. • Signal loss observed is not big enough to cause observed shift. • No width dependence can be seen • Looks like a surface effect • Caused by changes in drift field when going from 100V to 300V? • Effects related to shape of weighting field? • But! Why is no pitch dependence seen? (Remember: strip width/pitch=constant) • Timing effect • Is the 2 ns peak shift big enough to cause 10 µm shift?.
Conclusion • We see a distinct and systematic shift in mean residuals at 300V compared to 100V bias voltage. • We have not understood it yet, despite a lot of effort. • The question remains open… Suggestions are very welcome!
… RESERVE SLIDES
Residuals vs inter strip position SimulationPerfect alignment10 m misalignment 100 V 300 V in high pitch region =QL/(QL+QR)