
SlideServe
Menu
Préférences
© SlideServe · v2026

Observations

misha avatar
1 diapositives · 198 Views · Aug 31, 2014

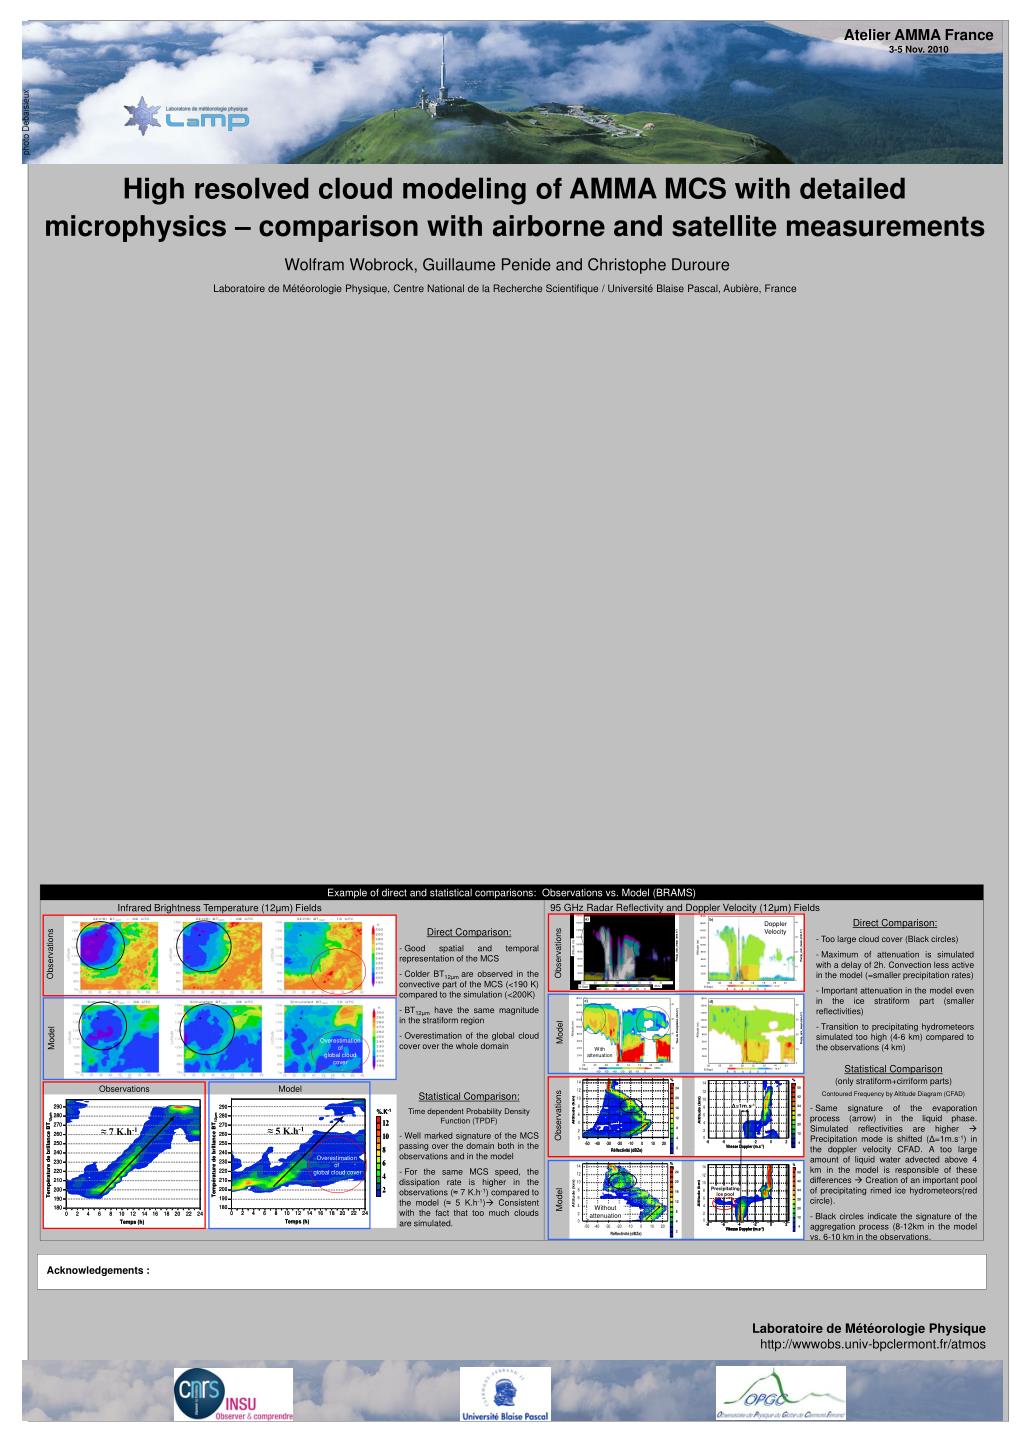
Example of direct and statistical comparisons: Observations vs. Model (BRAMS). Reflectivity. Doppler Velocity. Observations. Observations. Observations. Model. Model. Overestimation of global cloud cover. Model. Δ =1m.s -1. Observations. ≈ 5 K.h -1. ≈ 7 K.h -1. Overestimation
Observations - slide 1
01 / 1Observations
1 / 17

Télécharger la présentation

Observations
Une image / un lien ci-dessous est fourni (tel quel) pour télécharger la présentation

Politique de téléchargement : le contenu du site vous est fourni TEL QUEL pour votre information et votre usage personnel ; il ne peut être vendu, concédé sous licence ni partagé sur d’autres sites sans l’accord de son auteur.Le contenu vous est fourni TEL QUEL, pour votre information et votre usage personnel uniquement. Téléchargez la présentation en cliquant sur ce lien. Lors du téléchargement, si vous ne parvenez pas à télécharger une présentation, l’éditeur a peut-être supprimé le fichier de son serveur.Pendant le téléchargement, si vous ne parvenez pas à obtenir une présentation, le fichier a peut-être été supprimé par l’éditeur.

F I N

Plus de contenu associé

Transcription de la présentation
  1. Example of direct and statistical comparisons: Observations vs. Model (BRAMS) Reflectivity Doppler Velocity Observations Observations Observations Model Model Overestimation of global cloud cover Model Δ=1m.s-1 Observations ≈ 5 K.h-1 ≈ 7 K.h-1 Overestimation of global cloud cover Precipitating ice pool Model Atelier AMMA France 3-5 Nov. 2010 High resolved cloud modeling of AMMA MCS with detailed microphysics – comparison with airborne and satellite measurements Wolfram Wobrock, Guillaume Penide and Christophe Duroure Laboratoire de Météorologie Physique, Centre National de la Recherche Scientifique / Université Blaise Pascal, Aubière, France 95 GHz Radar Reflectivity and Doppler Velocity (12μm) Fields Infrared Brightness Temperature (12μm) Fields • Direct Comparison: • Too large cloud cover (Black circles) • Maximum of attenuation is simulated with a delay of 2h. Convection less active in the model (=smaller precipitation rates) • Important attenuation in the model even in the ice stratiform part (smaller reflectivities) • Transition to precipitating hydrometeors simulated too high (4-6 km) compared to the observations (4 km) • Direct Comparison: • Good spatial and temporal representation of the MCS • Colder BT12μm are observed in the convective part of the MCS (<190 K) compared to the simulation (<200K) • BT12μm have the same magnitude in the stratiform region • Overestimation of the global cloud cover over the whole domain With attenuation • Statistical Comparison • (only stratiform+cirriform parts) • Contoured Frequency by Altitude Diagram (CFAD) • Same signature of the evaporation process (arrow) in the liquid phase. Simulated reflectivities are higher  Precipitation mode is shifted (Δ=1m.s-1) in the doppler velocity CFAD. A too large amount of liquid water advected above 4 km in the model is responsible of these differences  Creation of an important pool of precipitating rimed ice hydrometeors(red circle). • Black circles indicate the signature of the aggregation process (8-12km in the model vs. 6-10 km in the observations. • Statistical Comparison: • Time dependent Probability Density Function (TPDF) • Well marked signature of the MCS passing over the domain both in the observations and in the model • For the same MCS speed, the dissipation rate is higher in the observations (≈ 7 K.h-1) compared to the model (≈ 5 K.h-1) Consistent with the fact that too much clouds are simulated. Without attenuation Time (h) Time (h) Acknowledgements : Laboratoire de Météorologie Physique http://wwwobs.univ-bpclermont.fr/atmos