Download
1 / 16
160 likes | 305 Vues
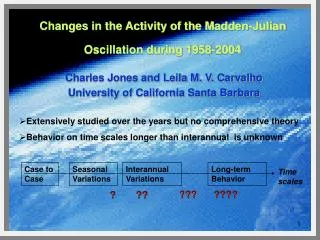
A probabilistic view of the Madden-Julian Oscillation Charles Jones Leila Carvalho University of California Santa Barbara. MJO Variability 1948-2007. Mean= ~3.8 MJOs/year. MJO identified with NN reanalysis. ~ 4.5 MJOs / year. ~ 3 MJOs / year. Change Point.

E N D
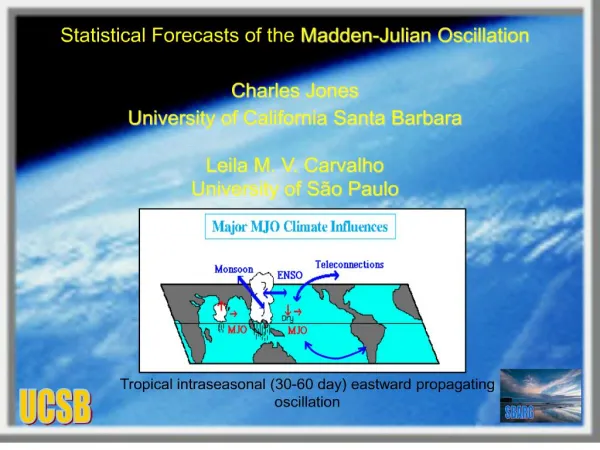
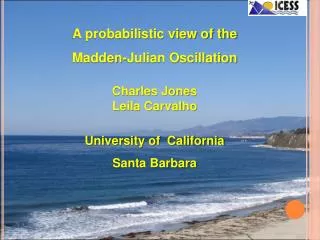
A probabilistic view of the Madden-Julian Oscillation Charles Jones Leila Carvalho University of California Santa Barbara
MJO Variability 1948-2007 Mean= ~3.8 MJOs/year MJO identified with NN reanalysis ~ 4.5 MJOs / year ~ 3 MJOs / year Change Point
Warming in Tropical Indian and Pacific Oceans • TIOPAC (15S-15N; 50E-150W) ~ 4.5 MJOs / year ~ 3 MJOs / year • mean SST anomaly • 30-yr running mean • Linear trend How does TIOPAC warming impact MJO activity? Activity: number of MJOs per year
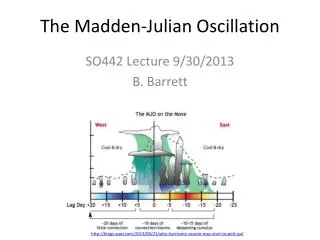
MJO Wheeler and Hendon (2004) • NCEP/NCAR reanalysis 1948-2007 • Band-passed U200, U850 • Combined EOF • First two modes • Phase diagram of PC1, PC2 • MJO event has amplitude > 0.9 • Phase rotates anti-clockwise
JMO of the MJO The Jones Model of the MJO Homogeneous stochastic model of the MJO Western Pacific Nine Phases 7 6 0 Non-MJO 8 5 MJO 1 8 West. Hem. & Africa Maritime Continent 0 81 conditional probabilities 1 4 2 3 Indian Ocean Homogeneous Transition probabilities Pji are constant in time Duration of MJOs vary stochastically [30, 90] days
JMOHMG Examples Time series of phase
MJO Variability Experiment I: “The MJO behaves as a random process, i.e. initiation, eastward propagation and termination do not depend on the mean state (SST) of the TIOPAC”. Transition conditional probabilities are constants • JMOHMG • Run 1000 simulations, each simulation 128 years (daily resolution) • For each simulation, compute number of MJOs per year • Each year has a pdf of number of events (pdf size: 1000 pts)
MJO Variability • OBS • q95th • q5th • JMOHMG • Interquartile spread • JMOHMG • Ensemble Mean ~ 3.7
MJO Variability Experiment II: “Warming (linear) trend in TIOPAC modulates the initiation of the MJO”. Transition conditional probabilities depend on SSTA JMOnonHMG • time • Moving window • Estimate: P01 P02 P03 P04 (primary MJOs) • Estimate: P81 (successive MJOs) • Record mean SSTA linear trend • Regressions • Non-homg (P01 + P02 + P03 + P04) • Homg (P01 + P02 + P03 + P04) • X SSTA • Non-homg (P81) • Homg (P81) • X SSTA
JMOnonHMG • Non-homg (P01 + P02 + P03 + P04) • Homg (P01 + P02 + P03 + P04) • Warmer TIOPAC Higher probability to initiate primary MJOs • Colder TIOPAC Lower probability to initiate primary MJOs • If too cold [P01,P02,P03,P04] non-homg = [P01,P02,P03,P04] homg
JMOnonHMG • Non-homg (P81) • Homg (P81) • Warmer TIOPAC Higher probability to initiate successive MJOs • Colder TIOPAC Lower probability to initiate successive MJO • If too cold shuts off P81
JMOnonHMG • OBS • q95th • q5th • Warming Trend in TIOPAC • Positive trend in MJOs per year • Very active years (7 MJOs /year) • Outside q95th • Caveat: only (linear) warming is modeled here; • Interannual and decadal (?) SST variations (ENSO, decadal ENSO) might be important in modulating MJO variability
MJO Variability Experiment III: “If warming (linear) trend in TIOPAC continues, how will it impact MJO activity”? Transition conditional probabilities depend on SSTA JMOnonHMG Projected SSTA linear trend 2008-2100
JMOnonHMG • 2008-2100 • q95th • q5th • JMOnonHMG • Ensemble Mean • JMOnonHMG • Interquartile spread • Very active years (~6-7 MJOs/year) much more likely
Summary q95th q5th How does TIOPAC warming impact MJO activity? JMO Only linear warming trend in TIOPAC was considered; interannual-to-decadal variations in SSTA can be significant (in progress)
Other possible applications of JMO Adapt for ensemble probabilistic forecasts of the MJO • Empirical relations: Pji parameters: • SSTA • Low level moisture convergence • Train on reanalysis • Apply on CFS ensemble members probabilistic MJO forecasts • weeks 1-4 Stochastic forcing of MJO on ENSO JMO Ocean model ENSO SSTA