Download
1 / 10
100 likes | 282 Vues
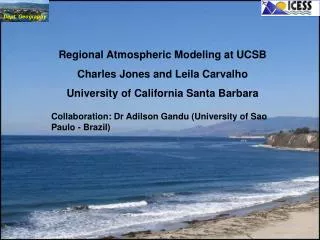
Dept. Geography. Regional Atmospheric Modeling at UCSB Charles Jones and Leila Carvalho University of California Santa Barbara. Collaboration: Dr Adilson Gandu (University of Sao Paulo - Brazil). UCSB - PSU/NCAR MM5 Real-Time Forecasts. Mesoscale Model Version 5 - MM5 :

E N D
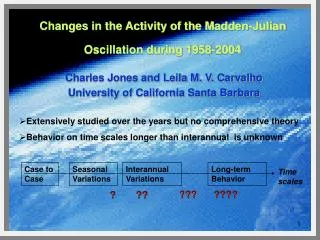
Dept. Geography Regional Atmospheric Modeling at UCSB Charles Jones and Leila Carvalho University of California Santa Barbara Collaboration: Dr Adilson Gandu (University of Sao Paulo - Brazil)
UCSB - PSU/NCAR MM5 Real-Time Forecasts • Mesoscale Model Version 5 - MM5 : • non-hydrostatic mesoscale model in sigma vertical coordinates (terrain following) • Research use at UCSB since 1998 • Current model configuration: • Three nested grids of 36, 12 and 4 km • Two-way nesting • Thirty eight sigma vertical levels • Physical parameterizations: • Schultz (1995) microphysics (rain, ice, graupel/hail) • Kain-Fritsch cumulus parameterization (36 and 12 km grids) • Rapid Radiative Transfer Model (RRTM) • Medium Range Forecast (MRF) planetary boundary layer model • Noah land surface model soil model • Two real-time forecasts • Initialized at 00Z and 60-hr forecasts • Initialized at 12Z and 48-hr forecasts
RaDyO Experiment 3-25 September 2008 • Outputs from MM5 real-time forecasts were saved for most days during the experiment (9-26 September 2008) • These are real-time forecasts – Initial/boundary conditions are derived from a forecast model with coarser resolution (NCEP - NAM) • We can re-run the model for the entire duration of the experiment using NCEP/NCAR reanalysis fields for initial and boundary conditions (instead of forecasts) • Include another grid in the channel (~1km grid spacing)
Example of simulation wind speed (10m) (mi/h) September 23/2008 (http://www.icess.ucsb.edu/asr/forecasts.htm)
Projects in Progress Regional and Global Modeling • Regional Atmospheric Modeling System (RAMS) • Ocean Land Atmosphere Model (OLAM)
Regional Atmospheric Modeling System (RAMS) • Developed at Colorado State University (1980s); Cotton, Pielke • Today: partnership ATMET-USA, Univ. São Paulo and CPTEC • Numerical model simulates atmospheric circulations: large-scale (hemispheric), mesoscale and large-eddy (boundary layer) • Basic equations: momentum (non-hydrostatic), continuity and thermodynamic 64 km 16 km 4 km 1km or higher resolution during RaDyo
Some advantages of using RAMS • Model is continuously developed and supported (MM5 has been phased out) • RAMS can be coupled to ocean models (e.g. SWAN - Simulating Waves Nearshore , POM - Princeton Ocean Mode, WAVEWATCH, etc.) • Local atmospheric measurements obtained during RaDyo experiment can be compared to simulations and further extended to other regions.
Ocean-Land-Atmosphere Model (OLAM) • Duke University, CPTEC, USP • Benefits of Global Domain • No need for lateral boundary conditions • Two-way communication between all areas of the globe • Ability to do global simulations • Include global ocean and ecosystem models – build unified Earth System Model • Enable climate studies that depend on two-way interactions between global, regional and micro-scales(e.g., Santa Ana winds, wildfires, coastal ocean circulations, soil-water-vegetation interactions etc)
Global grid structure based on icosahedron No overlapping of grid cells; no special nest communication; each cell communicates with neighbors independent of resolution Telescopic zooming over regions of high resolution interest Example: 10 grids: 200km, 100km, 50km, 25km, 12.5km, 6.3km, 3.1km, 1.6km, 800m, 400m
How can we contribute to the goals of RaDyO Experiment? • We can perform RAMS and OLAM high-resolution simulations for the experiment in Hawaii 2009 • We can provide high-resolution surface winds and all other atmospheric model variables (solar radiation, clouds, precipitation, etc…) • ?