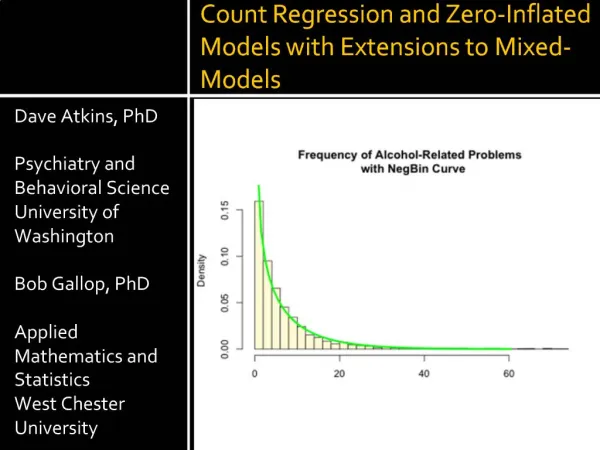
Issues with Mixed Models
Issues with Mixed Models. Model doesn’t converge…. OR. Convergence. Likelihood Landscape. Likelihood Landscape. Maximum Likelihood Estimation. Mean. Maximum Likelihood Estimation. Mean. Maximum Likelihood Estimation. Mean. Maximum Likelihood Estimation. Mean.


Issues with Mixed Models
E N D
Presentation Transcript
Maximum Likelihood Estimation Likelihood = the probability of seeing the data we actually collected given a particular model Maximum Likelihood Estimates = those values that make the observed data most likely to have happened
Sources of Convergence Problems • You estimate more parameters than data (or, in general, too many parameters • Severe collinearity (e.g., two predictors are exactly correlated) • Missing cells in your design • Predictors of vastly different metrics
Failure to converge GENDER ATTITUDE male female polite 16 0 informal 16 32 … and then trying to test the ATTITUDE*GENDER interaction
How can this happen? “Death by Design” (coined byRoger Mundry)
design analysis
Solutions to Convergence Problems • Drop a random slope(not preferred, should be reported) • Drop subjects/items for which there is not enough data (not preferred, should be reported) • Rescale variables so that they lie range between 0 and 1; or make them on similar metrics overall • Center continuous predictors • Nonlinear transformations of skewed predictors
Solutions to Convergence Problems • Change order of variable names in model formula • Have a balanced and complete design
The p-value conundrum What are the degrees of freedom? Howto get p-values out ofmixedmodels is not entirely straightforward… DouglasBates
“There are a number of ways to compute p-values from LMEMs, none of which is uncontroversially the best.” Barr et al. (2013)
Ways to get p-values • t-test/F-test with normal approximation • Likelihood Ratio Test • Boostrapping • Permutation • Markov Chain Monte Carlo (MCMC)
Getting p-vals with normal approximation xmdl coefs=data.frame(summary(xmdl)@coefs) coefs$p = 2*(1-pnorm(abs(coefs$t.value))) coefs
Function for getting p-vals with normal approximation create.sig.table = function(x){ coefs=data.frame(summary(x)@coefs) coefs$p = 2*(1-pnorm(abs(coefs$t.value))) coefs$sig = character(nrow(coefs)) coefs[which(coefs$p < 0.05),]$sig = "*" coefs[which(coefs$p < 0.01),]$sig = "**" coefs[which(coefs$p < 0.001),]$sig = "***" return(coefs) }
Likelihood Ratio Test First model needs to be nested in second
Likelihood Ratio The likelihood ratio expresses how many times more likely the data are under one model than the other Mean Mean
Important whendoing likelihood ratio tests lmer(…,REML=FALSE) http://anythingbutrbitrary.blogspot.com/2012/06/random-regression-coefficients-using.html
Random intercept onlymodels are known to beveryanti-conservativein many circumstances DANGEROUS!!! (cf. Barr et al., 2013,Schielzeth & Forstmeier, 2008)
Random intercept only Schielzeth & Forstmeier(2008)
Type I error simulation 10 subjects 10 data points each 5 of those in condition A,5 in B
Add to this explicit subject slopesfor A/B 10 subjects 10 data points each 5 of those in condition A,5 in B
Add to this explicit subject slopesfor A/B 10 subjects 10 data points each 5 of those in condition A,5 in B
Add to this explicit subject slopesfor A/B + take item slopes 10 subjects 10 data points each 5 of those in condition A,5 in B
Add to this explicit subject slopesfor A/B + take item slopes 10 subjects 10 data points each 5 of those in condition A,5 in B
“Keep it maximal” random effectsjustified by the design vs. random effectsjustified by the data Barr et al. (2013)
“Keep it maximal” “for whatever fixed effects are of critical interest, the corresponding random effects should be in that analysis” Barr et al. (2013)