Data Flow Diagrams
Learn about Data Flow Diagrams (DFDs) including elements, levels, notation, and construction rules for effective system modeling and analysis.


Data Flow Diagrams
E N D
Presentation Transcript
Recap • Collaboration Diagram Semantics – objects and messages – static representation of messages which could be sent – sequence of messages indicated • Collaboration Diagram Notation – rectangles for objects • Object signature: name : Class – messages with arrows • Message signature – [ guard] sequence number : result := messageName(int) • Collaboration Diagram Issues – multiplicity – when to use
Contents • Data Flow Diagrams (DFDs) • When • Where • Why • Notations/Elements • Examples
What is a Data Flow Diagram? • Known as DFDs • A way to model a real world situation • They are the interface between the real world activities and an understanding of how this can be converted into a computer system.
Why do we use DFDs? • It is a way of taking the physical view and converting it into a logical view. • The physical view - all documents involved • The logical view - the data they contain • Their main purpose is to communicate with the user, the analyst’s understanding of the scope of the required system
Analysis (What do we do?) Fact finding investigate business process and the current system modelling the current and required systems deliverables - requirements specification logical models of the required system Life Cycle Phases Planning Feasibility Study Analysis Design Code and Unit test Where do they fit in?
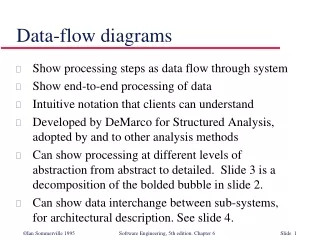
Data Flow Diagrams (DFD) • DFDs describe the flow of data or information into and out of a system • what does the system do to the data? • A DFD is a graphic representation of the flow of data or information through a system 3
Decomposition and Abstraction • Decomposition - Divide and subdivide into manageable size problems • Abstraction - Concentrate on the important issues and ignore the irrelevant
4 Main Elements • external entity - people or organisations that send data into the system or receive data from the system • process - models what happens to the data i.e. transforms incoming data into outgoing data • data store - represents permanent data that is used by the system • data flow - models the actual flow of the data between the other elements
Outside Entity Is anything outside the system that is of interest to the system. Can be a person, a company or another system. Customer a Outside entity shows the Name and a lowercase alpha character is used to uniquely identify it. Customer a If an outside entity is repeated for the purpose of neat layout a line is added across the top.
Data Flow Is shown by a line with an arrowhead, indicating the direction of the flow of data. Each data flow should be named to indicate what data is being passed. Nouns or adjectives only no verbs are permitted.
The Levels • Context - Overview - contains only one process • Level 1 - Utilises all four elements • Level 2 - A breakdown of a level 1 process • Level 3 - A breakdown of a level 2 process • There is no rule as to how many levels of DFD that can be used.
Rules Sequence not important - getting the Process correct is • Context or Level 0 - Identifies the system/ boundary/External Links • Level 1 - Overview of function • Level 2 - Breakdown to Understand • Hard to know where to stop • Rule of Thumb • If there are more than 8 data flows break it • Process of Identifying major Processes
The Procedure for Constructing DFD’s • Draw a document flow diagram of the current situation • Draw a systems boundary around the agencies that are part of the system • Draw a Context Diagram • Identify processes in the system • Complete the level 1 Current Physical DFD
Process box Data Flow External Entity D Data Store Notation • Data Flow • Process • External Entity • Data Store
Level 0 - Context Diagram • models system as one process box which represents scope of the system • identifies external entities and related inputs and outputs • Additional notation - system box
Level 1 - overview diagram • gives overview of full system • identifies major processes and data flows between them • identifies data stores that are used by the major processes • boundary of level 1 is the context diagram
Level 2 - detailed diagram • level 1 process is expanded into more detail • each process in level 1 is decomposed to show its constituent processes • boundary of level 2 is the level 1 process
Other Notation • Duplicates marked by diagonal line in corner • System Boundary • Elementary Processes - star in corner • Process that is levelled - dots on top
Rules for DFDs • Numbering • Labelling • Balancing 5
Numbering • On level 1 processes are numbered 1,2,3… • On level 2 processes are numbered x.1, x.2, x.3… where x is the number of the parent level 1 process • Number is used to uniquely identify process not to represent any order of processing • Data store numbers usually D1, D2, D3...
Labelling • Process label - short description of what the process does, e.G. Price order • Data flow label - noun representing the data flowing through it e.G. Customer payment • Data store label - describes the type of data stored • Make labels as meaningful as possible
Balancing and data stores • Balancing • any data flows entering or leaving a parent level must by equivalent to those on the child level • Data stores • data stores that are local to a process need not be included until the process is expanded
Conventions • Balancing • Process at lower level should have identical data flows if they flow out of a process • Modelling Data Stores • Only use DATA STORES used within this process on the diagram • Numbering • 1 - 1.1 - 1.1.1 • 1.2 - 1.2.1 • Labels • Should carry as much meaning as possible
Data Flows • Allowed to combine several data flows from lower level diagrams at a higher level under one data flow to reduce clutter • Flows should be labelled except when data to or from a data store consists of all items in the data store
Identifying operations • The SafeHome security functionenables the homeowner to configure the security system when it is installed, monitors all sensorsconnected to the security system, and interacts with the homeowner through the Internet, a PC, or a control panel. • During installation, the SafeHome PC is used to program and configure the system. Each sensor is assigned a number and type, a master password is programmed for arming and disarming the system, and telephone number(s) are input for dialing when a sensor event occurs. • When a sensor event is recognized, the software invokes an audible alarm attached to the system. After a delay time that is specified by the homeowner during system configuration activities, the software dials a telephone number of a monitoring service, provides information about the location, reporting the nature of the event that has been detected. The telephone number will be redialed every 20 seconds until a telephone connection is obtained. • The homeowner receivessecurity information via a control panel, the PC, or a browser, collectively called an interface. The interface displays prompting messages and system status information on the control panel, the PC, or the browser window. Homeowner interaction takes the following form…
Context Diagram • Find the people who send data into the system • Often data is part of a PHYSICAL transaction • When handing a bar of chocolate to a shopkeeper, you are handing him/her a barcode. • Find the people who get data out of the system. • The only data you need is data that is transformed or sent completely out of the system – not data that is handled by an operator within the system.
Data Flow Diagram Context-level DFD for SafeHome security function
Summary • Data Flow Diagrams (DFDs) • When • Where • Why • Notations/Elements • Safe Home example (Context DFD)
Identifying operations • The SafeHome security functionenables the homeowner to configure the security system when it is installed, monitors all sensorsconnected to the security system, and interacts with the homeowner through the Internet, a PC, or a control panel. • During installation, the SafeHome PC is used to program and configure the system. Each sensor is assigned a number and type, a master password is programmed for arming and disarming the system, and telephone number(s) are input for dialing when a sensor event occurs. • When a sensor event is recognized, the software invokes an audible alarm attached to the system. After a delay time that is specified by the homeowner during system configuration activities, the software dials a telephone number of a monitoring service, provides information about the location, reporting the nature of the event that has been detected. The telephone number will be redialed every 20 seconds until a telephone connection is obtained. • The homeowner receivessecurity information via a control panel, the PC, or a browser, collectively called an interface. The interface displays prompting messages and system status information on the control panel, the PC, or the browser window. Homeowner interaction takes the following form…
Verbs from the description • The SafeHome security functionenables the homeowner to configure the security system when it is installed, monitors all sensorsconnected to the security system, and interacts with the homeowner through the Internet, a PC, or a control panel. • During installation, the SafeHome PC is used to program and configure the system. Each sensor is assigned a number and type, a master password is programmed for arming and disarming the system, and telephone number(s) are input for dialing when a sensor event occurs. • When a sensor event is recognized, the software invokes an audible alarm attached to the system. After a delay time that is specified by the homeowner during system configuration activities, the software dials a telephone number of a monitoring service, provides information about the location, reporting the nature of the event that has been detected. The telephone number will be redialed every 20 seconds until a telephone connection is obtained. • The homeowner receivessecurity information via a control panel, the PC, or a browser, collectively called an interface. The interface displays prompting messages and system status information on the control panel, the PC, or the browser window. Homeowner interaction takes the following form…