Water scarcity report
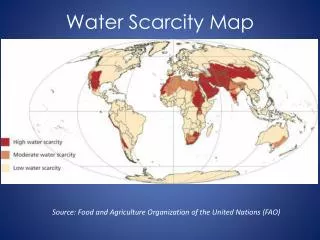
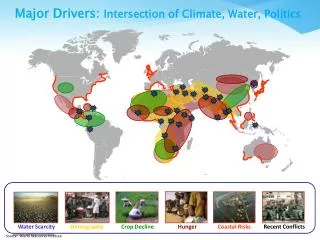
Water scarcity report . Skim read the report and annotate the key trends and patterns onto your resource sheet Add the factors that influence these patterns and trends Colour code them into environmental and human factors . How is this figure likely to change in the next 50 years? .

Water scarcity report
E N D
Presentation Transcript
Water scarcity report • Skim read the report and annotate the key trends and patterns onto your resource sheet • Add the factors that influence these patterns and trends • Colour code them into environmental and human factors
How is this figure likely to change in the next 50 years? World Water Use 2005
Lesson objectives: To examine the factors that influence access to safe water Some might argue that access to safe water is the most important factor affecting development. What do you think?
Gap minder: www.bit.ly/V00yA8 Does this show patterns or trends?
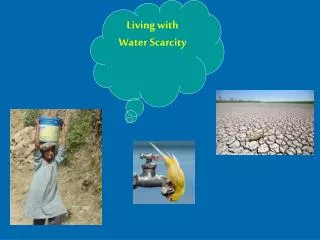
There are currently more than 1000 million people in the world that lack access to an easily accessible and safe water source, such as a connection to water mains or a protected well. • Instead, water access is limited or available through unprotected sources
MDG 7c • By 2015, halve the proportion of people without sustainable access to safe drinking water and basic sanitation
Roughly 88% of India’s available freshwater is used for agriculture. Agriculture contributes around 16% of India’s GDP and employs roughly half the countries workforce. However, the insufficient treatment of human waste and the use of pesticides have polluted many rural water supplies. Rural regions in India are often low-income areas with low standards of education, which can restrict the use and maintenance of sophisticated water treatment technologies.
In 1999, Coca-Cola company, established a plant in Plachimada, in the Palakkad district of Kerala, southern India.
Two years after production began local communities complained that water pollution and extreme water shortages were endangering their lives.
Residents protested that their wells had dried up because of the over exploitation of groundwater resources by the Coca-colaplant. • They now had to walk nearly five kilometres twice a day to fetch water. • They also argued that water was undrinkable and when used for bathing the water burned their eyes.
Coca cola • Create a mind map of political, social, economic and environmental factors that influence Kerala's access to safe drinking water • Remember to include FACTS and FIGURES, key PLAYERS, KEY TERMS • What could be the social, economic and environmental consequences of the issue?
Identify 3 reasons why the region of Tamil Nadu suffers from physical water scarcity • Describe methods used to improve access to safe drinking water • Explain why this may be a sustainable source of potable water • Evaluate the use of this method to achieve sustainable water
How can access to safe water be improved? • Small scale? • Large scale?
What are the implications? Whose perspective is this from? What assumptions does the cartoon make?