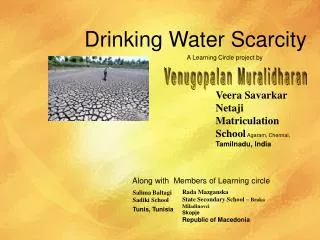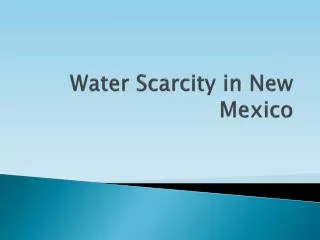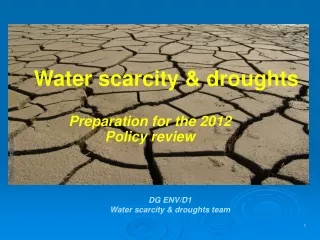
Water Scarcity Map
Water Scarcity Map. Source: Food and Agriculture Organization of the United Nations (FAO). Water Poverty Index 2002. Are the Water Scarce and Water Poor areas in the world the same? Why or why not?. Global Water Use. 10% Domestic Use. 20% Industry.
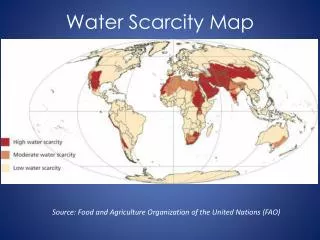

Water Scarcity Map
E N D
Presentation Transcript
Water Scarcity Map Source: Food and Agriculture Organization of the United Nations (FAO)
Water Poverty Index 2002 Are the Water Scarce and Water Poor areas in the world the same? Why or why not?
Global Water Use 10% Domestic Use 20% Industry Source: World Water Assessment Program (WWAP)
Consumption of agricultural water by type of irrigation 2006
The geography of water supply and demand Climate • Climatic zones are critical in determining water availability • Equatorial / tropical areas have higher rainfall than temperate / arctic areas. • High altitude areas have snowpack water reserves released in late spring. • Monsoon areas have one main peak, equatorial areas two peaks. • Some tropical areas experience recurring drought • River systemstransport this water, oftenat continental scale. • Flowsincreasedownstream as tributaries enter. • Seasonal changes in temperaturecancreate distinctive river regimes. • The relationshipbetween water inputs and outputs iswater balance Physical influences on water supply and scarcity 97.2% Ocean & saltwater Geology • Surface drainage occurs on rocks which are impermeablesuch as granite and clay. • Permeable rocks likelimestone, chalk and somesandstones store water, calledaquifers.
Human influences on water supply and scarcity • Blue water flow is the visible part of the hydrological system: surface flows and then recharging aquifers • Green water flow is water intercepted, stores and released by vegetation by evaporation and transpiration • Grey water is polluted water Supplycan be from: • Surface sources • groundwater sources • Freshwater is effectively a finite resource since only about 1% of freshwater is easily available for human use. • The water footprint indicates how much is required by consumers- and in an increasingly globalised world, the footprint of someone in a country like the UK will not be just local as so many products using water will have been produced elsewhere! • Humans affect the hydrological cycle atmany points of flows and storage:
Abundance of Transboundary Waters 148 countries include territory within one or more transboundary river basins 39 countries have more than 90% of their territory within one or more transboundary river basins 21 lie entirely within one or more of these watersheds Source: UNESCO
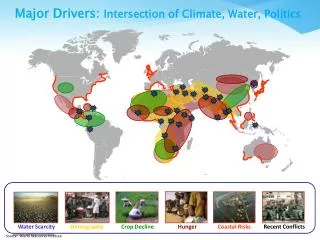
Water scarcity hotspots According to the International Water Management Institute environmental research organisation global water stress is increasing, and 1/3 rd of all people face some sort of water scarcity. Agricultural uses dominate in the growing need for food. Aral Sea faces environmental catastrophe, although recent attempts to reduce impacts of river diversions for especially cotton production Severe water scarcity N China, leading to South North transfer scheme-see later slide Egypt imports > 50% of its food because of physical scarcity R Ganges: physical stress from pollution and over abstraction Ogallala aquifer provides 1/3 all US irrigation water, but is seriously depleted: the water table is dropping by about 1m/yr. As a ‘fossil’ reserve, formed probably from past glacial meltwater flows, it is effectively a finite resource Australia; diversion ¼ of all water away from Murray Darling Basin for agriculture Much of sub Saharan Africa suffers from economic scarcity from especially poverty but also lack of infrastructural development . Some 1 bn people involved1
Water Conflicts Reductions because of: • Users abstracting/polluting upstream • Deteriorating quality • Impact of climate change Population growth Consumer demand Industrial growth Agricultural demand SUPPLY? Diminishing DEMANDS? Rising PRESSURE POINT- ie need for management. This is shown spatially as a ‘hotspot’ of conflict, see map on next slide. Pressure and hence tension and conflict may be over surface flow and/or groundwater supplies Dams and diversions and loss of wetlands are particularly contested. DIFFERENT USERS? Conflicting demands • International conflicts i.e. basin crosses national boundaries • Internal conflicts ie within a country • Conservation versus exploitation
In developing countries, 70% of industrial wastes are dumped untreated into waters where they pollute the usable water supply. Source:World Water Assessment Programme (WWAP)
Present and potential water conflict hotspots • As water supply decreases, tensions will increase as different players try to access common water supplies • Many conflicts are transboundary in nature, either between states or countries Tigris-Euphrates Iraq + Syria concerns that Turkey’s GAP project will divert their water Colorado: disputes between the 7 US states and Mexico it flows through. The river is so overused, that it no longer reaches the sea!. 90% abstracted before reaches Mexico The Aral Sea, an inland drainage basin, once the world’s 4th largest inland lake has shrunk sine the 1950s after the 2 rivers feeding it: the Amu Dayra and Syr Darya were diverted for irrigation. By 2007 the sea was 10% of original volume and split into 2 lakes. The ex soviet states are in conflict: Uzbekistan , Turkmenistan and Kazakstan. Ob Lake Chad Mekong Ganges Insert Figure 2.11 page 47 Okavango Zambezi La Plata Orange Note: although there have been rising tensions globally, many areas demonstrate effective management to diffuse the situation and create more equitable and sustainable demand-supply balance, such as the Mekong River Committee,& the Nile River Initiative Nile hotly disputed between Ethiopia and Sudan ,who control its headwaters, and Egypt .
The Colorado River: A Case Study • Video: The Colorado: a river in peril? 0’52 • Video: Colorado River: America’s Most Endangered River 2013
Reading • Chapter 5 Freshwater issues and conflict • Water Security and the Global Water Agenda • EU spotlight turns on Spain • Spain suffers worst drought • Middle East Water Management