Download
1 / 17
170 likes | 277 Vues
Explore the rise in government expenditures as a share of GDP over time, breaking down federal and state/local spending in different sectors. Understand transfer payments, public choice analysis, rent-seeking behaviors, and economic organization. Learn about public welfare, education, healthcare, and more.

E N D
The Economics of Collective Decision Making Chapter Six
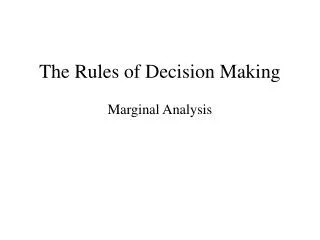
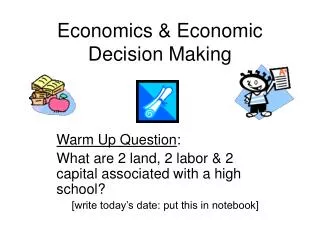
3.0 6.5 9.4 8.4 7.3 15.7 14.7 6.3 21.1 24.1 16.5 7.6 30.2 19.4 10.9 32.8 21.0 11.8 34.2 21.6 12.6 31.9 19.0 12.9 34.3 20.6 13.7 The Size of Government Government Expenditures as a Share (%) of GDP Federal 1930 State & local 1940 1950 1960 1970 1980 1990 2000 2003 • As is shown here, government expenditures as a share of GDP have risen over time.
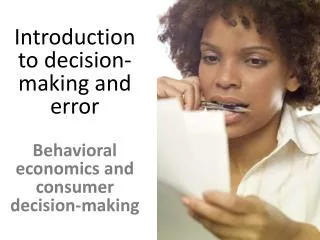
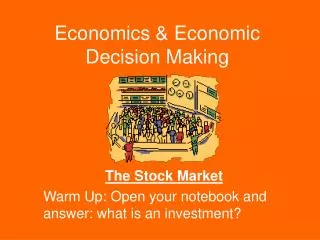
Social Security 22% Defense 18.8% NetInterest 7.1% Transportation3.1% Other11.8% Income Security 15.5% Medicare and health 21.7% Sources: Economic Report of the President, 2004, and Statistical Abstract of the United States, 2003. • A breakdown of the government expenditures at the federal level in 2003 are listed above.
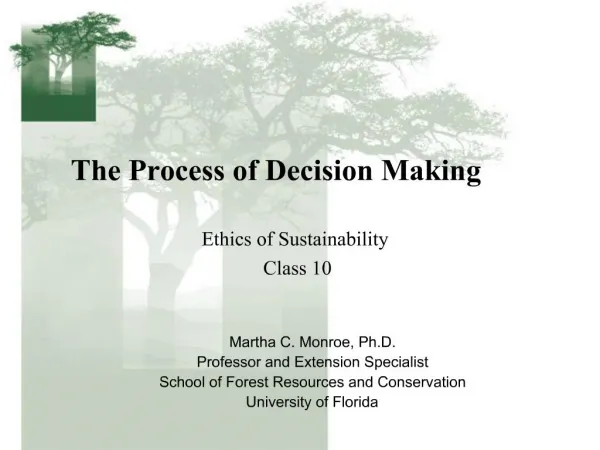
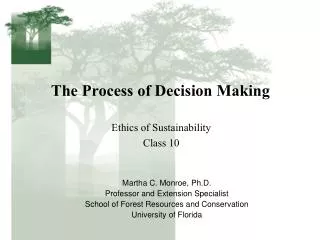
Insurance trusts 7.7% Public welfare & Health 22.3% Education32.2% Police &Fire Protection 7.9% Administration & other 12.2% Transportation 6.3% Utilities &liquor stores 7.1% Interest on debt 4.3% Sources: Economic Report of the President, 2004, and Statistical Abstract of the United States, 2003. • A breakdown of the government expenditures at the state and local level in 2000 are listed above.
Transfer Payments • Government expenditures that are not part of the GDP. • Monies are transferred from taxpayers to recipients. • Not associated directly with any production in the economy.
13.4% State & local governments 11.8% 11.3% 11.1% Federal government 7.7% 5.2% 5.1% 2.6% 1.1% Transfer payments as a % of national income 1930 1940 1950 1960 1970 1980 1990 2000 2002 Sources: Bureau of Economic Analysis, http://www.bea.gov.
Public Choice Analysis –applies the tools of economics to the political process -study of the complex interaction among: • voter-taxpayers • politicians • bureaucrats
Rational Ignorance Effect Recognizing their vote is unlikely to be decisive, most voters have little incentive to obtain information on issues and alternative candidates.
Bureaucrats Bureaucrats (persons that handle day-to-day operations of government) seek promotions, job security, power, etc. Larger budgets and program expansion generally serve the interests of both bureaucrats and their constituent groups.
$ 20 $ 5 $ 12.50 12 5 7.50 4 5 2.50 2 5 1.25 2 5 1.25 Benefits Derived by Voters from Hypothetical Road Project Tax payment PlanA Plan B Voter Benefits received Adams Chan Green Lee Diaz Total $40 $25 $25.00
Type1 Type2 Type4 Type3 Distribution of benefitsamong voters Widespread Concentrated Widespread Distribution of costsamong voters Concentrated • Consider how the 4 possible distributions of benefits and costs among voters affect the operation of representative government. • When benefits or costs are either both widespread or concentrated (type 1 or type 3), representative government tends to undertake projects that are productive and reject those that are unproductive.
Sugar Trade restrictions cost each household an average of $20 a year. Sugar grower benefit and contribute $13 million in campaign funds to keep restrictions in place.
THE IRON TRIANGLE • The House and Senate agriculture committees form the first leg of this triangle. Lawmakers who serve on the committees tend to come from farm districts and are staunch defenders of agriculture. This allegiance to agriculture can make it difficult for other interests to be heard as the committees hold hearings and draft legislation on matters reaching far beyond crops and meat production. • The second leg of the triangle is the farm lobby. The sugar industry and other farm-subsidy interests -- peanut, tobacco, wheat, and so on -- act as a lobbying bloc to preserve all agricultural price-support programs. They are also big campaign contributors. • The third leg of the triangle is USDA, a massive, sprawling department with a budget of roughly $60 billion a year and more than 100,000 employees. Critics have charged that the huge bureaucracy that administers farm programs exists to perpetuate itself. • http://www.opensecrets.org/pubs/cashingin_sugar/sugar02.html
Special Interest Effect • Logrolling: trading votes for projects with concentrated benefits and diffuse costs • Pork-barrel: inefficient projects with concentrated benefits
Rent Seeking Actions by individuals and interest groups designed to restructure public policy in a manner that will either directly or indirectly redistribute more income to themselves.
Quadrant 1:Apples, oranges, TV sets, food, housing, & most other goods Quadrant 2: Health care, food purchased with food stamps Quadrant 3:Post Office, water &electricity in manycities, toll roads, and many hospitals Quadrant 4:Public schools, roads, national defense, and law enforcement Economic Organization & Incentives Good is paid for by: Consumer purchaser Taxpayer or third party Privateenterprise Good is produced by: Government enterprise or contracting
The Role of a Constitution • Constitutions establish the procedures used to make political decisions. They can also limit the activities of government. • The framers of the U.S. Constitution incorporated restraints on the economic role of government. • The challenge before us is to develop constitutional rules and political institutions more consistent with economic efficiency and prosperity.