Download
1 / 43
430 likes | 554 Vues
Chapter Six Economics of Collective Decision-Making. The Size and Growth of the U.S. Government. 3.0. 6.5. 9.4. 8.4. 7.3. 15.7. 14.7. 6.3. 21.1. 24.1. 16.5. 7.6. 30.2. 19.4. 10.9. 32.8. 21.0. 11.8. 34.2. 21.6. 12.6. 31.9. 19.0. 12.9. 25.4. 14.3.

E N D
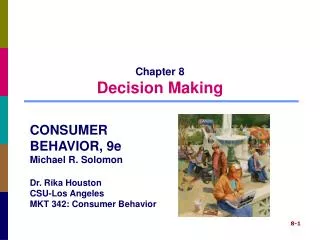
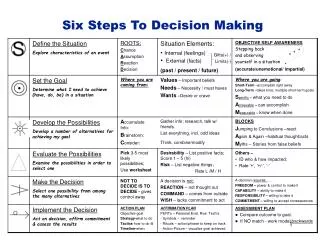
3.0 6.5 9.4 8.4 7.3 15.7 14.7 6.3 21.1 24.1 16.5 7.6 30.2 19.4 10.9 32.8 21.0 11.8 34.2 21.6 12.6 31.9 19.0 12.9 25.4 14.3 The Size of the US Government: 1930-2010 Government Expenditures as a Share (%) of GDP Federal 1930 State & local 1940 1950 1960 1970 1980 1990 2000 39.7 2010
Government Spending as a Share of the U.S. Economy: 1930 - 2010 • The previous slide shows total government spending (federal, state, and local) as a share of the US economy. • Total government spending accounted for only 9.4% of GDP in 1930, and only one third of this spending was at the federal level. • Government spending, particularly at the federal level, soared from 1930 to 1980. Total government spending rose from 9.4% of GDP in 1930 to 32.8% in 1980 (more than 3 times its 1930 level). • After remaining fairly constant between 1980 and 2000, the size of the US government has increased dramatically since (increasing to almost 40% of the U.S. economy in 2010).
How the Federal Government Spends 2010 Defense 20.1% Social Security 20.5% NetInterest 5.7% Transportation2.7% Income Security 18% Other9.2% Medicare and health 23.8% Sources: Economic Report of the President, 2011, and Statistical Abstract of the United States, 2010.
Utilities &liquor stores 7.0% How State & Local Governments Spend 2006 Insurance trusts 8.2% Education29.1% Public welfare & Health 17.7% Police & Fire Protection 4.5% Transportation 5.4% Administration & other 24.7% Interest on debt 3.4% Sources: Economic Report of the President, 2011, and Statistical Abstract of the United States, 2010.
19.5% State & local governments 11.8% 11.3% 11.1% Federal government 7.7% 5.2% 5.1% 2.6% 1.1% The Growth of Government Transfer Payments Transfer payments as a % of national income • Transfer payments tax income from some and transfer it to others. • As is illustrated here, government transfer payments have grown rapidly since 1930. 1930 1940 1950 1960 1970 1980 1990 2000 2010 Source:Bureau of Economic Analysis, http://www.bea.gov.
Differences and Similarities BetweenGovernment and Markets • Competitive behavior is present in both the market and public sectors. • Private sector action is based on mutual agreement; public sector (when democratic) is based on majority rule.
Differences and Similarities BetweenGovernment and Markets • When collective decisions are made legislatively, voters must choose among candidates who represent a bundle of positions on issues
Public Choice Analysis • Public Choice analysis– applies the tools of economics to the political process in order to provide insight concerning how the process works. • Self-interested behavior is present in both market and political sectors. • The political process can be viewed as a complex interaction among three groups: • voter-taxpayers • politicians • bureaucrats
Public Choice Analysis • The Voter-Consumer: • Voters support candidates that will provide them with the most government services and transfer benefits, net of personal costs. • Rational Ignorance Effect: Recognizing their vote is unlikely to be decisive, most voters have little incentive to obtain information on issues and alternative candidates. • Because of the rational ignorance effect, voters will be uninformed on many issues; such issues will not enter into their decision making process.
Public Choice Analysis • The Politician-Supplier: • Political officials are interested in winning elections. • Just as profits are the lifeblood of the market entrepreneur, votes are the lifeblood of the politician. • Rationally uninformed voters often must be convinced to “want” a candidate.
Public Choice Analysis • Civil servants (government bureaucrats) as political participants: • Bureaucrats (persons that handle day-to-day operations of government) seek promotions, job security, power, etc. • The interests of bureaucrats are often complementary with those of the interest groups they serve. • Larger budgets and program expansion generally serve the interests of both bureaucrats and their constituent groups.
Type1 Type2 Type4 Type3 Benefits and Costs Among Voters Distribution of benefitsamong voters • Consider how the 4 possible distributions of benefits and costs among voters affect the operation of representative government. Widespread Concentrated Widespread • When benefits or costs are either both widespread or concentrated (type 1 or type 3), representative government tends to undertake projects that are productive and reject those that are unproductive. Distribution of costs among voters Concentrated
Type1 Type2 Type4 Type3 Benefits and Costs Among Voters Distribution of benefitsamong voters • When benefits are concentrated and costs widespread (type 2), representative government is biased towards the adoption of counterproductive (inefficient) activity. Widespread Concentrated Widespread • Last, when benefits are widespread but the costs are concentrated (type 4), the political process often rejects productive projects. Distribution of costs among voters Concentrated
When Voting Works Well • Legislators will have a strong incentive to support political actions that provide voters with large total benefits relative to costs. • If a government project is productive, it will be possible to allocate the project’s cost so that all voters will gain. • When voters pay in proportion to benefits received, all voters will gain if the government action is productive (and all will lose if it is unproductive). Under these circumstances, there is a harmony between good politics and economic efficiency.
$ 20 $ 5 $ 12.50 12 5 7.50 4 5 2.50 2 5 1.25 2 5 1.25 Benefits Derived by Voters fromHypothetical Road Project • Consider this government program. With such programs, individuals receive varying levels of benefits. • Plan Ais simple (each voter pays the same amount)and may seem fair, but even as Adams is getting a deal (she values the program at $20 and pays $5) others do not even receive the value of their taxes. Tax payment Benefitsreceived PlanA Plan B Voter Adams Chan Green Lee • When each voter pays in proportion to benefits received (Plan B), each receives more benefits than costs. If tax plan B is used, all voters gain and the program would pass unanimously. This example shows that harmony between politics and economic efficiency can exist. Diaz Total $40 $25 $25.00
Special Interest Effect • A special interest issue generates large personal benefit for a small number of constituents while imposing a small individual cost on a large number of others. • Interest group members feel strongly about issues that provide them with substantial personal benefits. Such issues will dominate their political choices. • In contrast, voters bearing the cost of such legislation often are uninformed on the issue because it exerts only a small impact on their personal welfare and because of the rational ignorance effect.
Special Interest Effect • Politicians have a strong incentive to favor the views of special interests even if the action is inefficient. • Logrolling and pork-barrel legislation strengthen the special interest effect. • Logrolling: Trading votes • Pork-barrel legislation: Adding projects to legislation until enough politicians benefit and can get enough votes to pass
+ $10 - $03 - $03 + $4 - $03 + $10 - $03 + $4 - $03 - $03 + $10 + $4 - $03 - $03 - $03 - $9 - $03 - $03 - $03 - $02 - $02 - $02 - $6 - $9 Benefits Derived by Voters fromHypothetical Road Project • Consider a bill in Congress that would put a post office in district A, dredge a harbor in B, & build a military base in C. –– Net Benefits (+) or Costs (-) to Voters in Respective District –– New military base New PostOffice Dredging harbor • Benefits to A, B, & C voters vary by project. Voters of In total, voters in A, B, and C districts come out ahead despite the costs of paying taxes for activities in other districts – if they agree to vote together. Total in C in A in B * district A B • With this bill, there are no benefits to voters in D and E; further, the sum of benefits & costs for all voters together is negative. C D E Total • With majority rule, representatives from districts A, B, and C, can, and often will, pass counterproductive legislation. * Assume the districts are of equal size.
When Voting Conflicts with Economic Efficiency • Shortsightedness Effect:Issues that yield clearly defined current benefits at the expense of future costs that are difficult to identify. • The political process is biased toward the adoption of such proposals even when they are inefficient. • The shortsightedness effect explains why politicians will find debt financing and unfunded promises attractive -- they make it possible for politicians to provide current benefits to voters without levying an equivalent amount of taxes (to pay for them).
When Voting Conflicts with Economic Efficiency • Rent Seeking:Actions by individuals and interest groups designed to restructure public policy that redistribute more income to themselves. • Use of the taxing, spending, and regulatory powers of government that favor some at the expense of others. • Rent seeking diverts resources away from productive activities.
Income Transfers and Rent Seeking • Income transfers are a large and growing part of the U.S. economy. • Three major reasons why redistribution will reduce the size of the economic pie: • When taxes take larger shares of one’s income, reward derived from work is reduced. • As public policy redistributes a larger share of income, more resources flow into rent-seeking. • Higher taxes to finance income transfers induce tax payers to focus less on income-generating activities and more on actions to protect their own income.
Economic Inefficiencyand Government Operated Firms • Structure of incentives and the efficiency of government operated firms and agencies: • In the public sector, absence of profit motive reduces the incentive of producers to keep costs low. • Not a bankruptcy process capable of weeding out inefficient producers. • Public-sector managers seldom in a position to gain personally from measures that reduce costs. • Because public officials and bureau managers spend other people’s money, they have less incentive to be cost-conscious.
Political Favoritism, Crony Capitalism, and Government Failure
What is “Crony Capitalism?” • Crony capitalism is the situation where … • political decision-makers direct subsidies, grants, tax breaks, and regulatory favors toward businesses willing to provide them with campaign funds and other forms of political support. • It is a natural outgrowth of increases in government spending, constant changes in taxes, and expansion in regulation.
“Bootleggers and Baptists” • Crony Capitalism is often driven by the bootlegger–Baptist strategy: greedy action packaged as moral behavior. • Opportunistic rent-seekers often frame their programs in a manner designed to attract support from naïve idealists. • They argue their programs will enhance child safety, promote energy independence, save family farms, or some other widely supported goal. • But when one looks below the surface, one discovers that these programs are about government favoritism providing handsome profits to the well organized special interest groups.
“Bootleggers and Baptists” • Bootlegger—Baptist examples include: • Mattel incorporating costly testing procedures into the Consumer Product Safety Improvement Act of 2008. • The action increased the costs of rivals and drove used toy sellers like Goodwill out of the market. • General Electric partners with environmentalists to advocate subsidies and tax breaks for alternative energy sources. • This government favoritism increased demand for GE turbine engines, solar panels, and wind farms. • Result: GE earned $15 billion in 2010 and paid zero corporate income taxes.
MarketEntrepreneurs versus CronyCapitalists • Market entrepreneurs get ahead by providing consumers with products that are more highly valued than the resources required for their production. • Crony capitalists get ahead by providing political players with campaign contributions and other political resources in exchange for government contracts, subsidies, tax benefits, and other forms of political favoritism. • Projects of crony capitalists will often be counterproductive • Crony capitalism reflects government failure and undermines the legitimacy of the democratic political process.
The Economic Way of Thinking About Government • Markets and the political process will sometimes fail to allocate goods & resources efficiently. • Sometimes a conflict between winning elections and following sound policies. • Understanding the strengths and weaknesses of both sectors is important if we are going to improve our current economic institutions.
The Role of a Constitution • Constitutions establish the procedures used to make political decisions. They can also limit the activities of government. • The framers of the U.S. Constitution incorporated restraints on the economic role of government. • The challenge before us is to develop constitutional rules and political institutions more consistent with economic efficiency and prosperity.
Economic Organization: Who Produces, Who Pays, and Why It Matters
Quadrant 1:Apples, oranges, TV sets, food, housing, & most other goods Quadrant 2: Health care, food purchased with food stamps Quadrant 3:Post Office, water &electricity in manycities, toll roads, and many hospitals Quadrant 4:Public schools, roads, national defense, and law enforcement Production and Payment Good is paid forby: • The incentive to economize is influenced by who produces a good and who pays for it. Consumer purchaser Taxpayer or third party • Economizing behavior will be strongest when consumers purchase goods produced by private firms (quadrant 1). Privateenterprise Good is produced by: • The incentive to economize is reduced when payment is made by a third party and when production is handled by the government. Government enterprise or contracting
Quadrant 1:Apples, oranges, TV sets, food, housing, & most other goods Quadrant 2: Health care, food purchased with food stamps Quadrant 3:Post Office, water &electricity in manycities, toll roads, and many hospitals Quadrant 4:Public schools, roads, national defense, and law enforcement Economic Organization & Incentives • Quadrant 1: good is produced privately and consumers pay for it. Good is paid forby: Consumer purchaser Taxpayer or third party • Consumershave a strong incentive to economize because they are spending their own money. • Producers have a strong incentive to offer consumers value and produce efficiently because failure to do so will mean fewer customers and lower profits. Privateenterprise Good is produced by: Government enterprise or contracting • This combination leads to efficient outcomes.
Quadrant 1:Apples, oranges, TV sets, food, housing, & most other goods Quadrant 2: Health care, food purchased with food stamps Quadrant 3:Post Office, water &electricity in manycities, toll roads, and many hospitals Quadrant 4:Public schools, roads, national defense, and law enforcement Economic Organization & Incentives • Quadrant 2: good produced privately but paid for by someone else. Good is paid forby: Consumer purchaser Taxpayer or third party • Consumers have little incentive to economize because someone else is paying the bill. • Producershave little incentive to provide the good at a low cost because consumers are more interested in obtaining the highest quality, regardless of price. Privateenterprise Good is produced by: Government enterprise or contracting • This mix leads to high prices and large expenditures on the good.
Quadrant 1:Apples, oranges, TV sets, food, housing, & most other goods Quadrant 2: Health care, food purchased with food stamps Quadrant 3:Post Office, water &electricity in manycities, toll roads, and many hospitals Quadrant 4:Public schools, roads, national defense, and law enforcement Economic Organization & Incentives Good is paid forby: • Quadrant 3: The good is produced by the government and consumers pay for it. Consumer purchaser Taxpayer or third party • Consumerswill search for value because they are spending their own money. • Governmentproducers likely to be high-cost suppliers, particularly if they are a monopolist. Privateenterprise Good is produced by: Government enterprise or contracting • High prices and inefficiency in production are a likely outcome.
Quadrant 1:Apples, oranges, TV sets, food, housing, & most other goods Quadrant 2: Health care, food purchased with food stamps Quadrant 3:Post Office, water &electricity in manycities, toll roads, and many hospitals Quadrant 4:Public schools, roads, national defense, and law enforcement Economic Organization & Incentives Good is paid forby: • Quadrant 4: the good is produced by the government and costs are covered through taxation or by a third party. Consumer purchaser Taxpayer or third party • Political process determines what, how, and for whom goods will be produced. • Consumers will have few tools to discipline suppliers. Privateenterprise Good is produced by: Government enterprise or contracting • High prices and inefficiency in production are a likely outcome.
End of Chapter 6