Download

1 / 1
10 likes | 133 Vues
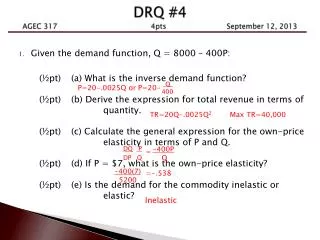
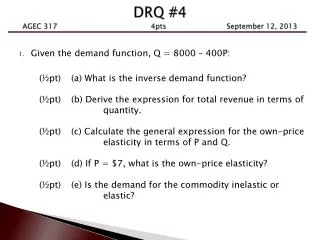
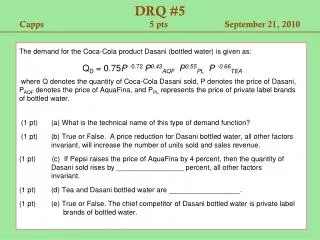
In this analysis, we examine the Average Variable Cost (AVC) function for BECAD, Inc., expressed as AVC = 12 - 0.4Q + 0.04Q². We will determine the quantity (Q) that minimizes AVC, calculate the minimum AVC value, and identify the technical term associated with this minimum. Additionally, we will derive the inverse demand curve based on the given relationship Q = 8,000 - 400P, and assess the marginal effects related to the price (P). This comprehensive evaluation aids in understanding BECAD's cost structures and demand dynamics.

E N D
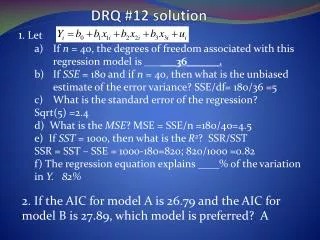
DRQ #3 Capps - Fall 2011 3 pts September 13, 2011 Suppose that for BECAD, Inc., you find that AVC = 12 - 0.4Q + 0.04Q2. (1 pt) (a) What is the level of Q which will minimize AVC? (1/2 pt) (b) What is the minimum AVC? (1/2 pt) (c) What is the technical name of this minimum value for BECAD, Inc.? 2. Suppose that Q = 8,000 – 400P. (1/2pt) (a) Derive the inverse demand curve. (1/2 pt) (b) Obtain the marginal effect associated with P.