Performance Benchmarks 2007 European Private Equity
170 likes | 311 Vues
Conducted by Thomson Reuters on behalf of EVCA. Performance Benchmarks 2007 European Private Equity. Methodology for Performance Benchmarks. All calculations are done at the fund level by Thomson Reuters based on cash flows and NAVs reported by participating LPs and GPs

Performance Benchmarks 2007 European Private Equity
E N D
Presentation Transcript
Conducted by Thomson Reuters on behalf of EVCA Performance Benchmarks 2007European Private Equity
Methodology for Performance Benchmarks • All calculations are done at the fund levelby Thomson Reuters based on cash flows and NAVs reported by participating LPs and GPs • Returns are net of management fees and carried interest • Returns are calculated with cash flows in Euros • Cash flow database contains altogether 1,223 European funds • Definitions: • Pooled IRR: IRR of a group of funds where their cash flows have been aggregated together before IRR calculation • Investment Horizon Return: IRR calculated with Net Asset Value as capital outflow at beginning of period, Net Asset Value at end of period, and actual cash flows in between
Background • More difficult market conditions for GPs in the last year • Leverage • Refinancing options • Pressure to invest • IPO market • Deal pipeline quality • Increased importance of reporting, benchmarking and analytics
Investment BenchmarksDatabaseEuropean Sample Growth Source: Thomson Reuters on behalf of EVCA
Net pooled IRRs since inception Annualised net pooled IRRs since inception to 31.12.2007 (Funds formed 1980-2007) Source: Thomson Reuters on behalf of EVCA
Mid-to Long-Term Venture IRR Remains In Positive Territory European Venture 3-,5-,10-Year Rolling IRRs Source: Thomson Reuters on behalf of EVCA
Mid-to Long-Term IRRs Show Strong Momentum for Buyout Funds European Buyouts 3-,5-,10-Year Rolling IRRs Source: Thomson Reuters on behalf of EVCA
VC and BO Funds in Europe and USA5-Year Rolling IRRs Europe USA Returns calculated with cash flows in USD Source: Thomson Reuters on behalf of EVCA
Net IRR Percentile 100 357.2% Pooled top quarter 23.5% 11.0% 75 2nd quarter 50 3rd quarter 25 4th quarter Top Quarter European Funds return 23.5%Funds Formed 1980-2007 Source: Thomson Reuters on behalf of EVCA
Top Half European Funds return 15.4%Funds Formed 1980-2007 Net IRR Percentile 100 357.2% Pooled upper half 15.4% 0.0% 50 Lower half Source: Thomson Reuters on behalf of EVCA
Indicators Show Good Average Performance for Europe European Private Equity Funds Formed 1980-2007Investment Horizon IRR (%) for period ending 31-Dec-2007 Source: Thomson Reuters on behalf of EVCA
European Venture Funds by Size Formed 1980-2007 Net IRRs to Investors Investment Horizon IRR (%) for period ending 31-Dec-2007 These results refer to the fund size, not the deal size. While funds are expressed in $, the IRRs are computed in €. Source: Thomson Reuters on behalf of EVCA
European Buyout Funds by Size Formed 1980-2007 Net IRRs to Investors Investment Horizon IRR (%) for period ending 31-Dec-2007 These results refer to the fund size, not the deal size. While funds are expressed in $, the IRRs are computed in €. Source: Thomson Reuters on behalf of EVCA
European Performance by Vintage Year Groups Net IRRs to Investors Grouped By Vintage Years From Inception to 31-Dec-2007 Source: Thomson Reuters on behalf of EVCA
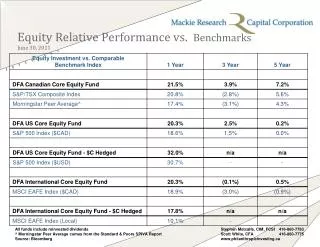
Private Equity Returns vs. Public Market Indices Comparators: annualised net pooled IRRs since inception to 31.12.2007 Source: Thomson Reuters on behalf of EVCA
Private Equity and Public Market Comparators Since Inception IRR for 2000-2007 *Comparators are Internal Rates of Return (IRR). IRRs for public market indices are calculated by investing the equivalent cash flows that were invested in private equity into the public market index. Then an equivalent IRR is calculated for each index. Calculations based on methodology proposed by J Coller and published by A Long and C Nickles. Source: Thomson Reuters on behalf of EVCA
Conclusion • Long-term performance • Stays constant at around 12.0% net IRR, with top quarter pooled IRR of 23.5% • Medium-term performance • 3-year IRR remains very strong for buyouts at 22.3% and decreases slightly to 3.9% for venture funds • 5-year rolling IRR continues its upward movement for both venture and buyout funds • Comparators with public markets • PE returns outperformed Morgan Stanley Euro Index and the JP Morgan Euro Bonds and were surpassed only by HSBC Small Company Index. • Buyout funds outperformed all public market comparators.