Download
1 / 18
200 likes | 393 Vues
Private Equity Performance and Liquidity Risk. Ludovic Phalippou (University of Oxford, Said Business School) (co-authors: Francesco Franzoni and Eric Nowak, both at Swiss Finance Institute – University of Lugano). Objective.

E N D
Private Equity Performance and Liquidity Risk Ludovic Phalippou (University of Oxford, Said Business School) (co-authors: Francesco Franzoni and Eric Nowak, both at Swiss Finance Institute – University of Lugano)
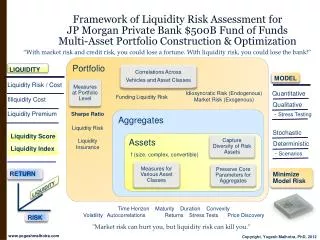
Objective • Long-term investors allocate large amounts to Private Equity (PE) funds to diversify (and because they can handle the illiquidity of these investments). • Key question: How much diversification benefits does PE offer? • To (partially) answer, we need to assess its exposure to known risk factors, and in particular to a newly documented one: liquidity risk. • We find that exposure to liquidity risk is sizeable and after accounting for the four most common risk factors (including liquidity risk), there is no alpha. Diversification benefits may be less than previously thought • What is the economic channel? We will investigate a refinancing channel Franzoni-Nowak-Phalippou, PE Liquidity risk
Why private equity? • $3 trillion asset class, cost of capital estimation is relevant for deal pricing and judging performance. Plus understanding drivers of performance (cross-sectional and time-series) is important. • Risk assessment is relevant for bank regulation (e.g. Basel capital requirements) and institutional risk management. • Liquidity effects likely to be magnified in Private Equity (PE) compared to public equity. Good laboratory to learn about the channels. Franzoni-Nowak-Phalippou, PE Liquidity
Related literature: Liquidity pricing • Theoretical arguments - why investors want to be compensated for liquidity risk (e.g. Acharya and Pedersen, 2005, Chien and Lustig, 2009, Chordia, Huh and Subrahmanyam, 2009) • Corresponding empirical literature (e.g. Pastor and Stambaugh, 2003) • Recent investigations of liquidity risk for other assets • Li, Wang, Wu and He, 2009: treasury bond market • Bekaert et al., 2008: stocks on emerging markets • Sadka, 2009: hedge funds • Bongaerts et al., 2008: credit derivative markets Franzoni-Nowak-Phalippou, PE Liquidity
Related literature: PE risk and return • Cochrane, 2005 (risk VC), Kaplan and Schoar, 2005 (return VC and PE), Phalippou and Gottschalg, 2009 (return VC and PE), Korteweg and Sorensen, 2009 (risk VC), Driessen, Lin and Phalippou, 2008 (risk VC and PE). • Previous research finds that private equity funds underperform public equity after fees but quality of the data sometimes questioned. Cost of capital estimations based only on CAPM and 3-factor model, plus focus on venture capital. • Here, we report evidence before fees from a different and extensive dataset in PE plus new focus: liquidity risk premium. Franzoni-Nowak-Phalippou, PE Liquidity
Data • PE performance data not publicly available • Use of a unique dataset: CEPRES • Contains cash flows for PE investments (unique feature) • Obtains data from private equity firms in exchange of access to services • Comprehensive and rich dataset (20 yrs of data, 45 countries, 4403 liquidated PE investments) • Earlier version of this database covering mainly venture capital is used by Cumming and Walz (2004) and Cumming, Schmidt and Walz (2009) Franzoni-Nowak-Phalippou, PE Liquidity
Methodology Boils down to an OLS estimation of the following equation It is derived from what the total return of an investment should be, given an asset pricing model Form portfolios Based on starting date (monthly frequency) Minimum number of investments set to 20 Reduce idiosyncratic volatility and influence of small investments, obtain return distribution closer to normal (and eliminate -100% returns) 7 Franzoni-Nowak-Phalippou, PE Liquidity
Performance measure Dependent variable: Modified IRR Use S&P 500 as a re-investment (and financing) rate PVinv = Present value of all investments at date of first cash inflow FVdiv = Value of all dividends received and re-invested until last payment NB: Standard errors clustered at investment starting year 8 Franzoni-Nowak-Phalippou, PE Liquidity risk
Descriptive statistics - Performance • Gross of fees performance about 19% (net of fees 12%) • Similar across regions and time sub-periods • Lower than implied in previous exercise • (partly due to re-investment assumption: blend of PE and S&P) 9 Franzoni-Nowak-Phalippou, PE Liquidity
Cost of Capital estimation (cont’) Dependent variable: Return of portfolio of investments • Estimate four factor Pastor-Stambaugh model • Market Beta of 1.3, large positive loading on HML • Liquidity risk Beta (0.678) is highly significant (equal to that of the 86th percentile for publicly traded stocks) • Results are robust to portfolio formation choices 10 Franzoni-Nowak-Phalippou, PE Liquidity
Cost of Capital decomposition • Liquidity risk premium is about 3% per annum (driving alpha close to zero) • Total risk premium for private equity was about 18% per annum 11 Franzoni-Nowak-Phalippou, PE Liquidity
What is the economic channel? Begin with simple evidence, at the investment level: • Investments held during the best liquidity times have return above 20% • Investments held during bad liquidity times have negative returns 12 Franzoni-Nowak-Phalippou, PE Liquidity
Hypothesis • Due to their high leverage, private equity investments are sensitive to the capital constraints faced by their providers of debt (banks and hedge funds). • Brunnermeir and Pedersen (2009) develop a theory in which the availability of capital - which they term funding liquidity - is positively related to market liquidity. • In our context: Times of low market liquidity coincide with times when private equity managers find it difficult to refinance their investments. In these periods, they may be forced to liquidate the investments or to accept higher borrowing costs, which hurts returns for this asset class. The link between private equity returns and market liquidity occurs via this funding liquidity channel. Franzoni-Nowak-Phalippou, PE Liquidity
Empirical approach • Empirically, we proxy for the evolution in funding liquidity with changes in the credit standards as reported in the Federal Reserve's Senior Loan Officer Survey. • This survey asks loan officers at main banks whether they tightened or loosened their lending standards relative to the previous quarter. • Axelson, Jenkinson, Stromberg and Weisbach (2010) argue that, in the private equity context, "this measure captures non-price aspects of credit market conditions, such as debt covenants and quantity constraints." They find this measure to be strongly related to the amount of leverage used to finance private equity investments. NB: Lown and Morgan (2006) present evidence that this variable strongly correlates with bank loans and is more important than interest rates in explaining loan volume. Franzoni-Nowak-Phalippou, PE Liquidity
Regression analysis – Cross-sectional evidence Shows that PE investment returns are strongly related to the average shock to aggregate liquidity during the life of the investment (P&S liquidity conditions) AND to credit standards. Franzoni-Nowak-Phalippou, PE Liquidity
Regression analysis – Time-series evidence • We create a time-series of aggregate cash flows (dividend minus investments; scaled them to make them stationary) • Relate these cash flows to market liquidity and credit standards. • Consistent with previous evidence: More dividends are paid when there are positive liquidity shocks and improvement in credit standards. Franzoni-Nowak-Phalippou, PE Liquidity
Anecdotal evidence PEI media Newsletter: Debt refinancing just got harder (August 18th, 2011) The bloodbath occurring in stock markets worldwide this week bodes ill for more than one type of portfolio. (…)The market meltdown – if it continues – spells trouble for the portfolios of many private equity funds and investors, too. There is the obvious impact to valuations, for if public market comparables collapse, buyout houses will (…) mark down their holdings. And such volatility could slow the recent stream of public market exits as well as sales to strategic buyers (...)A bigger problem for the private equity industry could be the impact on debt re-financing. The recovery in European leveraged loan marketshad been gathering momentum. The pace of high yield bond issuance and strategic sales of leveraged credits hit record levels and reinvigorated institutional loan markets in the first half of the year, according to a report released this week by Fitch Ratings.But the ratings agency warned an extended period of volatility in the second half of the year could affect private equity firms’ ability to refinance the circa €200 billion of portfolio company debt due to reach maturity between 2013 and 2016. Ed Eyerman, Fitch’s head of leveraged finance, told us this morning that the refinancing window has now essentially been shut for everyone. Franzoni-Nowak-Phalippou, PE Liquidity
Conclusion • Innovative approach to compute risk exposures for a non-traded asset • Easily generalizable to conditional asset pricing models • Significant liquidity risk premium for private equity of 3% per annum • Represents significant part of the cost of capital • Total risk premium for private equity (was) around 18% per annum • Alpha (gross-of-fees) was close to zero • Investments held during good liquidity times outperform significantly (robust to control for other macro-level variables) • Proxy for funding liquidity (tightening in credit standards) explain most of the effect of market liquidity on returns • Refinancing risk as proxied by tightening in credit standards explain most of the relation between innovations to market liquidity and returns (both cross-section and time-series evidence). Franzoni-Nowak-Phalippou, PE Liquidity