C HAPTER 11
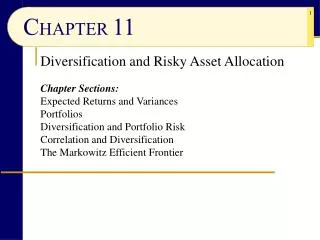
C HAPTER 11. Diversification and Risky Asset Allocation. Chapter Sections: Expected Returns and Variances Portfolios Diversification and Portfolio Risk Correlation and Diversification The Markowitz Efficient Frontier. Diversification. Diversification


C HAPTER 11
E N D
Presentation Transcript
CHAPTER11 Diversification and Risky Asset Allocation Chapter Sections: Expected Returns and Variances Portfolios Diversification and Portfolio Risk Correlation and Diversification The Markowitz Efficient Frontier
Diversification • Diversification • Spreading your investments across a number of asset classes to eliminate some, but not all, of the risks of investing • “Don’t put all your eggs in one basket” • Old, old saying … as opposed to … • “Put all your eggs in one basket … And Watch That Basket!” • Mark Twain (maybe erroneously attributed)
Diversification (continued) Diversification has been one of the best methods to reduce risk
But How Do We Measure Risk?! • We Have Come Full Circle! • Way back in Chapter 1, we introduced the tug-of-war between risk and return • We saw how the higher the average annual return, the higher the standard deviation (and its companion measure variance) from the average annual return • We have studied the major financial asset classes • Mutual funds, stocks, bonds, “cash” • We discussed the risks and returns of each • Return is easy to measure • How much money did you make? How long did it take? • Risk is very difficult to measure • It is even harder to anticipate – Witness 2008!
Variance & Standard Deviation • Variance and its more useful companion, standard deviation, tell us how much an asset class will vary from the expected return • These measures are readily available from the investment community • And da’ numbers ain’t pretty… • For any randomly selected stock on the NYSE, the standard deviation is 49.24%! • That means in any one year, many stocks on the NYSE – the most stable stocks! – will vary up or down close to 50% from their annual average return • So how can we reduce the variance? In other words, how can we reduce the risk?
Variance & Standard Deviation (continued) • The answer, of course, is to diversify! • If we go from 1 randomly selected stock to 2 randomly selected stocks, • The standard deviation goes from 49.24% down to 37.36% • If we randomly select 10 stocks, • The standard deviation goes down to 23.93% • 20 stocks, • 21.68% • And so on… Diversifying our stock portfolio reduces our risk substantially (as measured by reduced variance and standard deviation)
Variance & Standard Deviation (continued)
Variance & Standard Deviation (continued) But there is a limit to which diversification can reduce your risk in any given asset class (in this case, stocks). Why? “Correlation.”
Correlation • Correlation • The tendency of the returns of two assets to move together • Imperfect correlation is the key reason why diversification reduces portfolio risk as measured by the portfolio standard deviation • No two investment returns will be exactly the same • Positively correlated assets tend to move up and down together • Negatively correlated assets tend to move in opposite directions
Correlation (continued) • Correlation coefficient • The measure of how closely returns on assets move together • The correlation coefficient ranges from: Mathematicians often use the variable r for the correlation coefficient
Correlation (continued)
Correlation (continued) • So how does this answer our question about why diversification can only reduce by so much the risks of owning stocks? • Although stocks are not perfectly correlated, • They are positively correlated enough so that stocks in general tend to move in the same direction • This is why we often refer to stock investments as a whole as the stock market • Even though at any given time, some companies are doing well, others are doing poorly, and many are simply chugging along as they always have done
Correlation (continued) • “Darned! That is still too much risk for me! Think I’se gonna’ stick to bonds…” • You are a very conservative, risk-averse investor & you don’t like the volatility of stocks • Therefore, you decide to place all your investments into bonds • You will accept the lower return from the bonds in exchange for the lower risk of the bonds • Oops! Bad idea! Why? Because, like stocks, • Bonds are positively correlated with themselves • They also will tend to do well & do poorly as a whole • And they are often negatively correlated with stocks! • Stocks & bonds often (but not always) move in opposite directions
Correlation (continued)
Correlation (continued)
Correlation and Diversification (continued) • A combination of stocks and bonds actually created a portfolio with less risk • While earning you more return than just bonds • If you are seeking less risk, it not only pays to diversify within an asset class, • It pays to diversify among asset classes • The same kind of relationship occurs with domestic and foreign stocks and bonds (although less now than in the past) • Although diversification is still not a guarantee of positive results • No diversification scheme worked well in 2008! • We have a name for choosing the appropriate mix for an investor • It is called …
Asset Allocation • Fancy term for… • “How much should I have in stocks? How much in bonds? How much of each stock & bond type?” • Many advisors suggest a formula such as… • Subtract your age from 100 (or 110 or 120) • That is the percentage of stocks you should own • The rest should be in bonds • Example: A 40-year-old would have 100-40 or 60% invested in stocks and 40% in bonds • “Poppy-cock!” say others (myself included) • Buy high-quality stocks and put up with the risk • Once you near retirement, start buying bonds
Asset Allocation (continued) • Example: $100,000 –How do I divvy it up? • $25,000 Bonds • $15,000 High grade corporate & government • $5,000 High yield (a.k.a. junk) bonds • $5,000 Global bonds • $75,000 Stocks • $25,000 Domestic growth and income • $25,000 Global growth and income • $10,000 Aggressive growth • $10,000 International • $5,000 Small company stocks
Rebalancing • Some of those same advisors that suggest asset allocation also suggest the technique of rebalancing • Every year, check to see if your percentages are still in balance • If stocks have had a banner year, you might now be at 70/30 instead of your target 60/40 allocation • Sell enough stocks and buy enough bonds to bring the balance back to your target 60/40 allocation • Likewise, if stocks have tanked, sell bonds & buy stocks to bring the percentage back up to 60/40 • Forces you to “Do the right thing” • “Buy Low, Sell High”
Stocks & Bonds in Retirement • Many advisors suggest that retirees shed the bulk of their stock investments in favor of bonds and cash investments • The only problem is… • People are living much, much longer • A 50-year-old living today has a 50/50 chance of living to see 100 years old! • As you near retirement, start migrating your investments from stocks to bonds • But don’t abandon stocks entirely! • See illustrations, Bonds versus Stocks versus Balanced
Stocks vs Bonds vs Balanced Having a balanced portfolio means that you almost never have the best returns in any one year. However, it also means you will very rarely ever have the worst returns in any one year, either. In addition, although it is very unlikely that you will not equal or surpass an all-stock-portfolio, you should do much better than an all-bond-portfolio. But you already know what we are going to add, right? There are no guarantees!
Dollar Cost Averaging • A system of buying an investment at regular intervals with a fixed dollar amount • With Dollar-Cost Averaging, there is always “Good News” • “The market is up! Good News!” • Your account is worth more • “The market is down! Good News!” • Next month, you will get more shares at a lower price when the $50 or $100 comes out of your paycheck or checking account Yippee! Huh?!
Dollar Cost Averaging Example (continued) In this example, your average cost per share is $6.92 ($3,000 / 433.333 shares). But the price per share is $7.50. So although it looks like you should have simply broken even, you actually made money because you bought more shares at the lower prices. The value of the shares is $3,250 (433.333 * $7.50).
Dollar Cost Averaging (continued) • By always investing the same amount of money, you are purchasing more shares when the price is low and fewer shares when the price is high • Your average cost per share should be lower than your average price per share • However, it is not a guarantee of success • Dollar cost averaging is not going to help a lousy investment turn a handsome profit! • But it does makes investing very, very easy • For mutual fund investors, that is • It is a bit trickier with stocks & bonds • But not impossible
Mutual Funds & Diversification • Speaking of Mutual Funds • Wasn’t diversification one of the two main reasons why so many investors choose mutual funds? Yes! • (The other is professional money management) • But does that mean mutual funds necessarily have less risk than individual portfolios or the market as a whole? • Well, it all depends on which mutual funds we are talking about … For examples, go to morningstar.com or finance.yahoo.com, enter a mutual fund such as DODGX or AWSHX and find the link to [Risk]. Try some other mutual funds. Let’s look at some examples…
Mutual Funds & Concentration Many market historians have observed the tendency of mutual fund inflows and outflows to be a fairly reliable contrarian indicator of market performance.
CHAPTER11 – REVIEW Diversification and Risky Asset Allocation Chapter Sections: Expected Returns and Variances Portfolios Diversification and Portfolio Risk Correlation and Diversification The Markowitz Efficient Frontier Next week: Chapter 15, Stock Options