Effective Map Creation in ArcView: Practical Guidelines
Learn how to optimize shading for prints, select appropriate classification types, and consider viewer impact for clearer map illustrations in ArcView. Understand the importance of optimal shades and how each classification type can affect the representation of data.

Effective Map Creation in ArcView: Practical Guidelines
E N D
Presentation Transcript
MAP CREATION USING ARCVIEW:PRACTICAL ISSUES Tom LargoBureau of EpidemiologyNovember 13, 2006
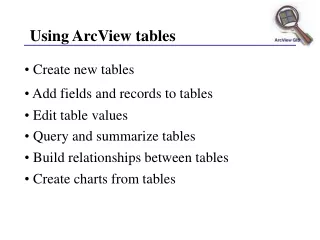
TOPICS TO COVER • Optimal shades to select for B & W printed MDCH documents • Determination of appropriate classification type • Equal Interval • Quantile • Natural Breaks • Standard Deviation
SHADING • Max number of discernible groups: 4 • white • black • two shades of grey • To determine optimal shading, had to work backwards – viewing copy of PDF
SPECIFICATIONS • In ArcView 3, the specifications for the two grey shadings were:
SPECIFICATIONS • In ArcView 9, the specifications are:
EXAMPLE Problem!
EXAMPLE One solution
ONE LAST SUGGESTION • See proof of final from printer to ensure can distinguish grey shades
SELECTING A CLASSIFICATION TYPE • Each type will usually result in a different illustration • Impact on viewer will be different depending on type selected • Q: How do you determine which one to use?
STANDARD DEVIATION(ranges based on std dev around mean rate)