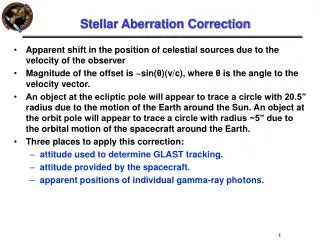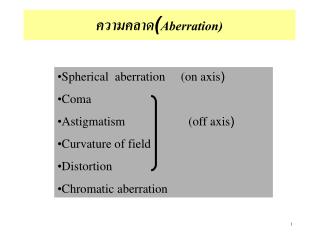
Aberration Correction and Possible Structural Tomography in Complex TEM
320 likes | 541 Vues
Aberration Correction and Possible Structural Tomography in Complex TEM Fu-Rong Chen(1) and Ji-Jung Kai(1) Dept. of Engineering and System Science, National Tsing-Hua University, Hsin Chu, Taiwan. -8.23.2003 Beijing TEM conference. Better electron microscopes.

Aberration Correction and Possible Structural Tomography in Complex TEM
E N D
Presentation Transcript
Aberration Correction and Possible Structural Tomography in Complex TEM Fu-Rong Chen(1) and Ji-Jung Kai(1) Dept. of Engineering and System Science, National Tsing-Hua University, Hsin Chu, Taiwan -8.23.2003 Beijing TEM conference
Better electron microscopes It is very easy to answer many of these fundamental biological questions; you just look at the thing! Make the microscope one hundred times more powerful, and many problems of biology would be made very much easier. It would be very easy to make an analysis of any complicated chemical substance; all one would have to do would be to look at it and see where the atoms are. The only trouble is that the electron microscope is one hundred times too poor. Develop new tool to discover new science ! • Richard F. Feynman • 12.29.1959 American Physics Society, CIT • (There’s plenty of room at the bottom)
y o Electrons Specimen Microscope transfer function (Cs ,Cc,Δf…) Diffraction Plane YgYg*=Ig (phase lost) g 2g o -2g -g Image Plane Exit wave is blurred by the function exp(-iχ) (phase lost) Df The total phase shift due to spherical aberration and defocus is c=p/2(Csl3a4+2Dfla2)
V1(r,z) V2(r,z) V2(r,z) V1(r,z) Phase Reciprocal Space Real Space j=C∮V(r,z)dz-e/h∫∫B⊥(r).dA a(h,k,l): atomic positions
Non-interferometric Phase Retrieval Method Phase Retrieval Reciprocal Space Real Space a) Transport Intensity Equation(TIE) Propagating wave Initial wave I1 I2 I3 Df (I(r,0) j)=-kzI(r,z) b) Electro-Static Phase Plate (Zernike was awarded Nobel prize at 1953) Amplitude Kinematic Diffraction Electron Dynamic Diffraction ? (oversampling, phase extension) phase Resolution extension and exit wave reconstruction in complex TEM F.-R. Chen et. al., Ultramicroscopy (2003), PRL(submitted) JEM(1999), JEM(2001) I=1+[AF-1(cosc P(H))+ jF-1(sinc P(H))]
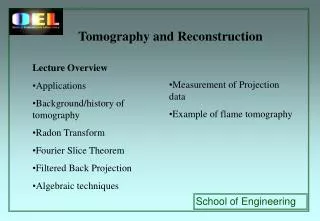
Process Flow (Images 3D Structure) Exit Wave Reconstruction (aberration correction) Exit Wave->Structure (quantification of EW) Structural Tomography ?
Process Flow (Images 3D Structure) Exit Wave Reconstruction (aberration correction) Initial Phase of Image using TIE Modulus Phase Exit Wave->Structure (quantification of EW) Phase Modulus Structural Tomography ? (I(r,0) j)=-kzI(r,z) Phase object under-focus over-focus zI(r,z) Reconstructed Phase Df = ±60 nm
Y1i Y2i . . Yni Y1i Y2i . . Yni 1 Ye= S(Yni) N Process Flow (Images 3D Structure) Exit Wave Reconstruction (aberration correction) Initial Phase of Image using TIE Modulus Phase Exit Wave->Structure (quantification of EW) Refine the phase by Self-consistent propagation (Gerchberg-Saxton algorithm) Phase Modulus Structural Tomography ? √ Ini
Y1i W* Ye=F-1( ) W* W Process Flow (Images 3D Structure) Exit Wave Reconstruction (aberration correction) Initial Phase of Image using TIE Modulus Phase Exit Wave->Structure (quantification of EW) Refine the phase by Self-consistent propagation (Gerchberg-Saxton algorithm) Phase Modulus Structural Tomography ? Aberration correction (linear imaging) Ye=Aoexp(i jo) exp(c(Df1))P1(H) Y1i Y2i . . Yni exp(c(Df2))P2(H) . . ye exp(c(Df2))P2(H) W
Sfi Sfi FA= Fj= A j Process Flow (Images 3D Structure) Exit Wave Reconstruction (aberration correction) Initial Phase of Image using TIE Modulus Phase Exit Wave->Structure (quantification of EW) Refine the phase by Self-consistent propagation (Gerchberg-Saxton algorithm) Phase Modulus Structural Tomography ? Aberration correction (linear imaging) Ye=Aoexp(i jo) I(g)=∫Ye(g+g’) Ye*(g’)T(g+g’,g’)dg’ I(r)=YiYi*+S(pDl)2n/n!(2nYi2nYi*) c2=Sfi2=S(Ii(r)-I(r)iexp)2 dA S(FA)2SFAFj SFAFo dj SFAFj S(Fj)2SFjFo Refinement by Non-Linear imaging A=Ao+dA j=jo+dj
Part 1:Consider Non-linear Contributions to the Image G1 G2 0 Linear image Non-linear image
spatial coherence Temporal coherence Pure phase transfer function For FEG TEM α<<1, this term can be ignored
Represent the diffraction wave in the regular Fourier optics approach Taylor expansion For FEG TEM, ~1
Fourier Transform Higher resolution information Linear image Non-linear image where
These images were recorded using a JEOL 3000F FEGTEM, the lens aberration parameters are Cs=0.6mm at 300kV, focal spread df=4 nm, divergent angle a=0.15 mrad and three-fold astigmatism a3=855.8 nm and fa3=117.11 mrad. Complex Oxide (NbW)O3 Df ( 30 images)
Amplitude Phase Reconstructed exit wave
The Nb16W18O94 has a structure of M30-3xM4xO90+x with lattice constants a= 1.2251 nm, b= 3.6621 nm, and c=0.394 nm. Amplitude a b Cation: (Nb, W) Phase Anion: (O)
Information limit Super High Resolution • How to achieve Super High Resolution • phase extension • Exit wave → structure Fourier Transform Reconstructed Exit wave The phase had been corrected inside the information limit
For 200 kV FEG TEM phase transfer function (in Scherzer defocus) Exit wave reconstruction Phase extension • The retrieved Exit Wave contains structural information up to • “information limit” • 2) To extend the structural information beyond “information limit”, • we need diffraction intensities for “resolution extension”.
Amplitudes Phases (2Å)-1 (1Å)-1 Phase Extension For HRTEM It is possible to enhance the resolution by phase extension From images → phases & amplitudes inside the small cycle From diffraction intensities→ amplitudes inside the big cycle
reciprocal space real space Gerchberg-Saxton algorithm (Electron diffraction) Complex Maximum Entropy (Complex Exit wave) Maximum entropy image processing can extrapolatemissing information to yield a most-probable answer I(blurred)=I(good image)O(blurring function)’ Corrected Data Resolution enhancement by phase extension I(good) L=-SI(good)log( )+l(I(good) O-I(blurring)) I(initial)
“Correct” phase information was extrapolated to next higher frequency after MEM deconvolution Phase extension Phase information before MEM deconvolution
CdSe nanoparticle viewed along the [112] direction -260 nm -268 nm -276 nm -284 nm -294 nm -298 nm The thickness of this particle is 6 nm. The lens aberration parameters used were Cs=0.6mm focal spread, df =3 nm and divergence angle, a=0.2 mrad.
Extrapolated information from MEM {444} Information limit Phase of exit wave After phase extension {444} →0.87Å
Process Flow (Images Structure (positions and atomic type) S-State model Exit Wave Reconstruction (aberration correction) Yn(R,z)≈{1+P3exp(-|P1|(R-Ri)2)[exp{-kP1P2/2Eo}-1] P1=Eoo (energy of s-state) P2=t P3=Cj (excitation parameter) Eo=voltage of TEM k=1/l Structural reversion Exit Wave->Structure (quantification of EW) Analytic Multi-Slice Yn(R,z)≈qon-(idzl/4p)[Sqoi(2qon-i)] Structural Tomography ? Yo=qo=exp(iV) Yn(R,z)=Aexp[i(nV+Df)] Df=tan-1[C1(2V)+iC2((V)2] A= |1+iC1(2V)+iC2((V)2| C1=tl(n-1)/8p C2=tl(n-1)(2n-1)/24p V=projected potential of a unit cell dz Y1=(qoPdz)qo t=n*dz Exit wave can be related to phase grating of one unit cell
Atomic lens Optical lens Au Al
From Exit wave to Structure Classical Approach: Multislice Method q1(x,y) q2(x,y) q3(x,y) qn(x,y) The potential of each slice projected into a plane specimen can be subdivided into thin slice qn(x,y)=exp{iσVn(x,y)}
Exit wave from analytical solution and Multislice (10nm) Modulus Phase Modulus Phase Analytic Solution Au Si Modulus Phase Phase Modulus MultiSlice
Quantification of Exit Wave- (S-state Wave) Structure Cu segregates to Al grain boundary Modulus Phase
(112) (111) Structural Tomography (Discrete)? (111) (112) (110) Modulus Phase 1. Projection-Slice theorem Bracewell, Aust. J. 198 (1956) 2. Convolution-Backprojection Algorithm Proc. Nat. Acad. Sci. 68,2236-2240 (1971) (c) Exit Wave of CdSe nano-particle (reconstructed by Complex TEM) Df
Conclusions • 一流的設備≠一流的研究 • 不要忽略人類的智慧才能讓發揮功能 人生七十才開始 祝 郭先生有八十歲的智慧 和青春的健康