Download
1 / 25
250 likes | 366 Vues
Move to Improve: Promoting Physical Navigation to Increase User Performance with Large Displays. Robert Ball Virginia Tech November 10, 2006. Motivation: Cuban Missile Crisis: September/October 1962. U-2 Spy plane takes high-resolution pictures of parts of Cuba

E N D
Move to Improve: Promoting Physical Navigation to Increase User Performance with Large Displays Robert Ball Virginia Tech November 10, 2006
Motivation: Cuban Missile Crisis: September/October 1962 U-2 Spy plane takes high-resolutionpictures of parts of Cuba http://www.gwu.edu/~nsarchiv/nsa/cuba_mis_cri/1.jpg Picture taken of SA-2 missile construction site http://www.gwu.edu/~nsarchiv/nsa/cuba_mis_cri/1.jpg
Analysis of pictures • U-2 Spy place takes high-resolution pictures. • Analyst must interpret pictureswith this: • Why: physical navigation Inside the CIA’s National Photographic Interpretation Center (NPIC), Washington D.C., 1962. http://www.gwu.edu/~nsarchiv/nsa/cuba_mis_cri/7.jpg
Related Work Games!
Physical navigation related work HMDHead-mounted display CAVE
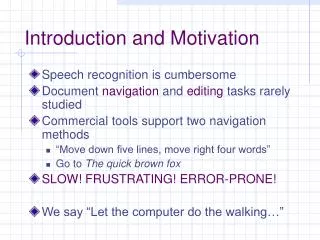
Experiment Motivation Research Questions: • Do users prefer physical navigation with large, high-resolution displays? Why? • If so, does this result in improved user performance? • Is physical navigation truly more beneficial than virtual navigation in terms of performance time?
Experimental Design – data and visualization • 3,500 houses for sale in Houston, TX • Semantic zooming scheme, zooming only resulted in more information being displayed. • To see all of the houses with all the details shown would require about a 100-monitor display.
Experimental Design – display, interaction, and tracking • 24 tiled monitors • Wireless mouse • Vicon system
Experimental Design – tasks • 4 tasks: • Navigation • Search • Pattern finding • Insight finding • Insight task: • Used paper, pen, and stand. • No correct answers. • Other tasks: • Walked and spoke answer. • Only one correct answer. Within-subject design Between-subject design
Experiment results - performance • 2-way ANOVA: main effects for • display width (F(1,1324)=20.56, p<0.01) • task type (F(2,1324)=77.05, p<0.01) • Tukey HSD analysis showed different task types were all in different groups, so:
Experiment results - Performance • We found no significant results based on the level of insight for the fourth task. • So, we focus on results for the first three tasks in this section.
Virtual Navigation Analysis – zooms • 2-way ANOVA: main effects for • task type (F(3,1400)=416.2, p<0.01) • display width (F(1,1400)=34.8, p<0.01) • near-significant interaction of task type and display width (F(3,1400)=2.4, p=0.06).
Virtual Navigation Analysis – pans • 2-way ANOVA: main effects for • task type (F(3,1400)=301.3, p<0.01) • display width (F(1,1400)=63.86, p<0.01) • interaction of task type and display width (F(3,1400)=17.22, p<0.01).
Physical Navigation Analysis Douglas-Peucker algorithm used to guarantee that what we were analyzing was actual movement - not jitter.
Physical Navigation Analysis, cont. • 2-way ANOVA for total X distance: main effects for • task type (F(3,1400)=75.1, p<0.01) • display width (F(1,1400)=24.1, p<0.01) • interaction of task type and display width (F(3,1400)=4.0, p<0.01)
Experiment conclusions Do users prefer physical navigation with large, high-resolution displays? YES When faced with a choice of physical or virtual navigation, 100% of the participants chose only to physically navigate.
Experiment conclusions If so, does this result in improved user performance? YES
Experiment conclusions Is physical navigation truly more beneficial than virtual navigation in terms of performance time? YES • Virtual navigation has a greater negative correlation on performance than physical navigation. • The number of zooms correlated with performance with a correlation coefficient of 0.69. • The number of pans correlated with performance with a correlation coefficient of 0.68. • However, physical distance traveled did not significantly correlate with performance.
Future work • Do the results from this study extrapolate to 3D data? To non-geospatial data? • How does fatigue/longitudinal use of such displays affect the results of this experiment?