Download
1 / 8
80 likes | 94 Vues
To commemorate 70 years since food rationing in the UK, explore how rationing during World War II influenced food habits. Discover the history, data insights, and changes in diets over time. Engage in a hands-on activity using National Food Survey data to compare food consumption trends from 1942 to 1999. This resource from the Imperial War Museum and BBC provides a rich learning experience on how food choices have evolved.

E N D
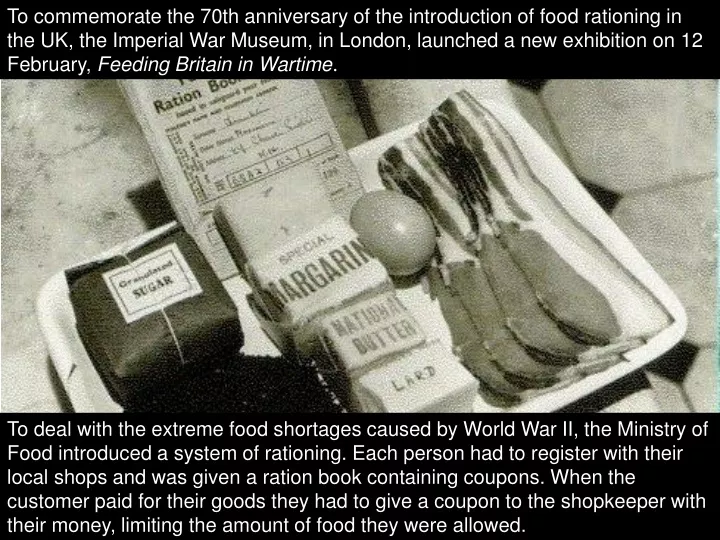
To commemorate the 70th anniversary of the introduction of food rationing in the UK, the Imperial War Museum, in London, launched a new exhibition on 12 February, Feeding Britain in Wartime. To deal with the extreme food shortages caused by World War II, the Ministry of Food introduced a system of rationing. Each person had to register with their local shops and was given a ration book containing coupons. When the customer paid for their goods they had to give a coupon to the shopkeeper with their money, limiting the amount of food they were allowed.
Rations fluctuated throughout the war – these are the lowest levels that they fell to per week: • Bacon and ham – 4oz • Sugar – 8oz • Tea – 2oz • Meat – One shilling worth • Cheese – 1oz • Preserves – 8oz [per month]Butter – 4oz • Further ration of cooking fat and margarine. • How does this compare with what you eat in a week?
How has what we eat changed over the last 70 years? The BBC produced this chart to show the differences:
Each year, from 1942 to 1999, the government carried out a National Food Survey to find out what people ate. Use this data to create your own version of the BBC’s chart showing what you think are the most important changes over this time.
Up2d8 mathsKeep calm and carry on Teacher Notes
Keep calm and carry on Introduction: Has the food we eat ever been more critiqued than in the present day? Do you consider organic or air miles? Do you shop locally? Are you part of the slow food movement? Is your favourite take-away a curry, a pizza or fish and chips? The food options open to us at the moment seem almost endless but it hasn’t always been this way. This year sees the 70th anniversary of the introduction of food rationing. An anniversary being marked by various television and radio shows as well as an exhibition at the Imperial War Museum. This resource uses the context of rationing to explore how our shopping habits and the food we eat has changed over time and, in doing so, will allow students the opportunity to use proportional reasoning to compare and represent data graphically.Data used in this resource comes from the National Food Survey. Content objectives: This context provides the opportunity for teachers and students to explore a number of objectives. Some that may be addressed are: • select, construct and modify, on paper, and using ICT, suitable graphical representations to progress an enquiry and identify key features present in the data • solve simple problems involving ratio and proportion using informal strategies. Process objectives: These will depend on the amount of freedom you allow your class with the activity. It might be worth considering how you’re going to deliver the activity and highlighting the processes that this will allow on the diagram below:
Activity:The activity gives students the opportunity to compare data and trends over time and to represent this graphically. In doing this they will also explore proportional changes. Students are introduced to food rationing and are first asked to consider how this compares to their own diet. The activity then introduces a graphical representation of the difference between wartime Britain’s diet and the current diet, looking at how many more biscuits, oranges, pork, lamb, potatoes, preserves and lard are eaten now compared to 1945. Students are introduced to the National Food Survey and are asked to construct their own chart of the changes to the national diet through time.. Differentiation:You may decide to change the level of challenge for your group. To make the task easier you could consider: • reducing the amount of data, maybe just giving the data for selected years or selected foods • scaffolding the task – asking the students to calculate specific multipliers first, and then to generalise their method to their chosen food. To make the task more complex, you could consider: • giving the students free access to the data • reducing the scaffolding for the task – leaving the students to decide independently how to go about constructing the graphic • asking for a copy of the graphic to be annotated, explaining how the student calculated the length of one or two of the bars • asking for a commentary explaining the key features of what the graphic represents. This resource is designed to be adapted to your requirements. Working in groups: This activity lends itself to paired and small group work and, by encouraging students to work collaboratively, it is likely that you will allow them access to more of the key processes than if they were to work individually. You will need to think about how your class will work on this task. Will they work in pairs, threes or larger groups? If pupils are not used to working in groups in mathematics, you may wish to spend some time talking about their rules and procedures to maximise the effectiveness and engagement of pupils in group work (you may wish to look at the SNS Pedagogy and practice pack Unit 10: Guidance for groupwork). You may wish to encourage the groups to delegate different areas of responsibility to specific group members. Assessment:You may wish to consider how you will assess the task and how you will record your assessment. This could include developing the assessment criteria with your class. You might choose to focus on the content objectives or on the process objectives. You might decide that this activity lends itself to comment-only marking or to student self-assessment. If you use the APP model of assessment then you might use this activity to help you in building a picture of your students’ understanding. Assessment criteria to focus on might be: • recognise approximate proportions of a whole and use simple fractions and percentages to describe these (Numbers and the Number System level 4) • solve simple problems involving ratio and direct proportion (Calculating level 5) • use the equivalence of fractions, decimals and percentages to compare proportions (Numbers and the Number System level 6). Probing questions: You may wish to introduce some points into the discussion, which might include: • which of the bars in the BBC graphic do you think was the easiest to calculate? Why? • from the BBC graphic, what have been the major changes? • why do you think these changes have taken place? • what’s the same and what’s different about the way that you eat and your parents/grandparents eat? • what’s the same and what’s different about the bars on either side of the graphic? • what other ways can you think of to show this information?
You will need: The PowerPoint presentation and the data from the National Food Survey. There are four slides: The first two slides set the scene. They very briefly describe rationing and show the lowest that rations fell, asking students how these compare to their own diet. The third slide shows the graphic from the BBC website. The final slide introduces the data and sets the task. Depending on the level of independence of your group you may wish to introduce more scaffolding than is given in the slide.