Download
1 / 9
90 likes | 106 Vues
This study focuses on generating a land cover map for Southern Africa using SPOT-4 VEGETATION imagery and FAO/LCCS legend. The method involves generating composite images, cleaning SWIR strips, unsupervised classification, and spectral analysis to identify separability of classes. Results show high separability. Future work includes defining spectral classes, refining legend categories, and exploring new correspondences with field experts.

E N D
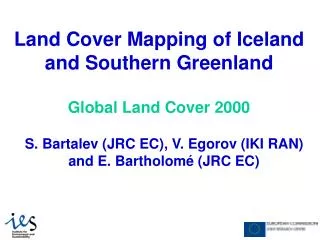
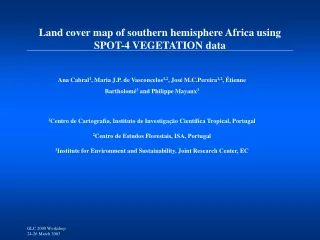
Spectral separability of Land cover classes in Southern Africa. An application of LCCS. Ana Cabral1, Maria J.P.de Vasconcelos1,2, José M.C.Pereira1,2, 1Cartography Center, Tropical Research Institute, Portugal 2Centro de Estudos Florestais, ISA, Portugal
Context and objective • Our task in GLC2000 is to produce a land cover map for Southern Africa., using SPOT –4 VEGETATION imagery • The Legend of the land cover map follows the FAO/ LCCS • Our strategy is to work with monthly composites derived from S1 data
Methods • Generate the best possible composite data set Twelve monthly composite images, by applying Albm3. • Clean the lines strips generated by defective SWIR detectors in the CCD array of VEGETATION. • Unsupervised classification of the full data set (36 bands) ISODATA with 40 classes. • First approach to the highest hierarchical level of the legend by studying ancilary data and by visual interpretation of the composites. • Analysis of the spectral separability of the 40 classes with the Jeffries-Matusita distance.
SWIR Strips January composite image with strips January composite image wihout strips • The method adopted to clean the SWIR strips was based on finding rules to identify the affected pixels, using classification trees. The values of the identified pixels were replaced by those obtained using a regression equation between the red and SWIR composite bands (excluding the strips).
Compositing and Unsupervised classification Monthly composite image with third lowest Albedo value Unsupervised classification with the twelve monthly composite data • The ISODATA unsupervised classification was based on the 36 composite channels, using forty classes.
Principal Components analysis • Color composite RGB PC3-PC2-PC1. The first three PCs were obtained from the 36 monthly composites channels, and contain 78.9 % of the variance of the full data set. The major biomes of Southern Africa can be visually identified.
Legend In the first approach, the legend adopted was very simplified and include several classes: • Cultivated and managed terrestrial areas; • Build up areas; • Herbaceous open vegetation; • Herbaceous closed vegetation • Closed shrubland (thicket) • Open shrubs (shrubland) • Closed woody vegetation or permanently flood land; • Open vegetation or permanently flooded land. • Broadleaved evergreen forest; • Needleleaved decidous forest; • Open forest (Woodland); • Open woody vegetation; • Perennial natural waterbodies; • Natural waterbodies (standing) • Uncosolidated material • Consolidated hardpans; • Loose and shifting sands; • Bare rock and / or coarse fragments
Spectral separability • Generate a training set for the forty classes obtained by clustering (training areas over 36 bands) • Apply the J-M distance to quantify pair-wise separability between classes • RESULTS • All classes are completely separable, with J-M values close or equal to 2.0 in the majority of class pairs • To evaluate the influence of multitemporality of the dataset on class separability we calculate • J-M for the training areas using only one monthly composite. In this case, the separability betwwen classes droped drastically, with many classes unseparable from each other (J-M values lower than 1.0)
Current status and future development • The preliminary stages have shown that it is feasible to define at least 40 spectral classes with the current data set • The correspondence between the forty classes and the 18 legend categories identified is now under development • The disaggregation of the higher level legend categories into a more ellaborate legend is under study with the support of experts in tropical vegetation and extensive field experience available at IICT, map data, and literature review. • New correspondences between spectrally separable classes and legend categories wil be explored iteratively.