Download
1 / 46
460 likes | 583 Vues
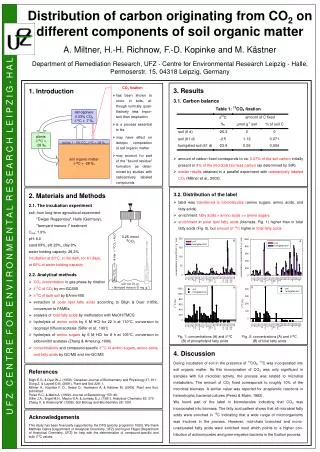
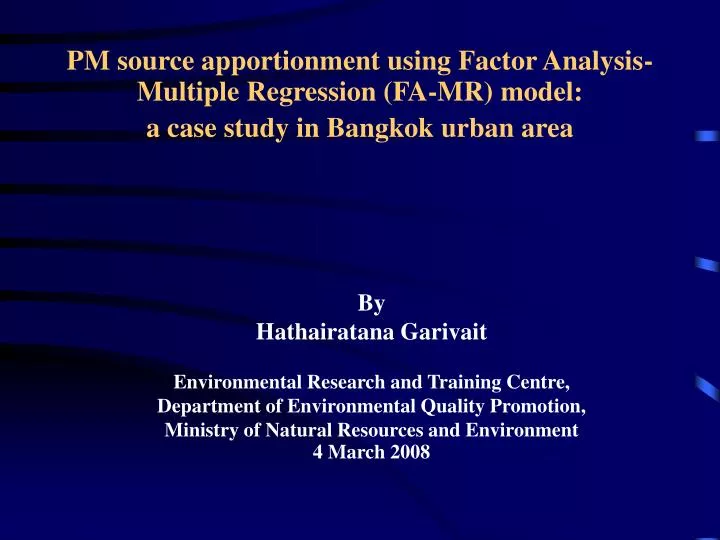
PM source apportionment using Factor Analysis-Multiple Regression (FA-MR) model : a case study in Bangkok urban area. By Hathairatana Garivait Environmental Research and Training Centre, Department of Environmental Quality Promotion, Ministry of Natural Resources and Environmen t

E N D
PM source apportionment using Factor Analysis-Multiple Regression (FA-MR) model:a case study in Bangkok urban area By Hathairatana Garivait Environmental Research and Training Centre, Department of Environmental Quality Promotion, Ministry of Natural Resources and Environment 4 March 2008
Contents • Introduction to source impact assessment methods • of air pollution • 2. Fundamental of receptor model • 3. Factor Analysis-Multiple Regression Model (FA-MR) • Application of FA-MR for PM source apportionment • in Bangkok urban area in 1996
Emission inventory Dispersion model Impact at receptor Filter analysis Source contribution Receptor model Source impact assessment methods for air pollution Dispersion models Receptor models
Dispersion model • The dispersion models can deal explicitly with emissions from • single, identifiable sources within the same source category. • However, the dispersions model must build on several potentially • uncertain inputs, such as • emission data • meteorological data • the transport-diffusion-transformation-deposition mechanisms
Receptor model Receptor models start with the measurement of a specific feature of the aerosol at the receptor and after the fact calculate the contribution of a specific source type. Measurable atmospheric features include particle size distribution, component identification (organic, inorganic and radioactive), component chemical state and concentration, time and spatial variation.
AQ Models Statistical First-principle Emissions- Based (e.g., CMAQ) Hybrid Receptor CMB FA Lag. Eulerian (grid) PMF Molec. Mark. Norm. Source Specific* “Mixed PM” UNMIX Air Quality Models(These provide approaches to identify source impacts) Curtsey to Prof. Armistead Russell, GIT, USA
Enrichment Factors Time series analysis Spatial series analysis Receptor Models Chemical methods Microscopic methods Optical Qualitative analysis S.E.M. Chemical Mass Balance Quantitative analysis Automated S.E.M. Multivariate data analysis method(e.g.,FA-MR)
Diffusion model (DM) Chemical mass balance model (CMB) Performance DM can estimate the contribution for each individual emission source. CMB can estimate the only contribution for each emission source category. Data Requirement DM requires the exact emission rate, position, & emitting conditions for individual stacks and facilities. CMB requires the emission source profile (chemical composition) for each emission source category (soil, automobile, steel industry, etc.) Assumption for the prediction DM assumes that the meteorological situations can not change. CMB assumes that the chemical composition can not change. Comparison between the diffusion model and chemical mass balance model
Parameters Receptor models Dispersion models Source data Meteorological data Pollution control devices Fugitive emissions Utility applicability Observation data Specific source advantages They are based on observed data, and hence independent of source data The use of meteorological data is optional Do not affected the results They take into account unidentified and fugitive emissions They are cost effective and very useful for developing local pollution control strategies disadvantages They are site specific Require large data sets on physical and chemical analysis They cannot identify any point source as well as cannot deal with source multi-colinearity very efficiently disadvantages Models results are highly de-pendent on source emission inventory The use of meteorological data is necessary and affects the result considerably They are not accurate when inventories are fitted with pollution control devices. They cannot identify fugitive emissions (unknown sources) Collection of meteorological and source data is complex and costly control strategies advantages They are universal and can be applied to many areas Observation data needed only for validation of models They are very suitable for specific sources. Source specific data do not pose the problems of multi-collinearity
Thus, the receptor model and dispersion model are complimentary in their approach to source apportionment and using both can reduce the limitation of each alone.
Chemical conversion of gases to low volatility vapors Hot vapor Low volatility vapor Condensation Primary Particles Homogeneous nucleation Wind blown dust + Emissions + Sea spray + Volcanoes + Plant particles Condensation growth of nuclei Chain Aggregates Droplets Coagulation Coagulation Coagulation Rainout & washout Sedimentation Particle diameter, mm Transient nuclei or Aitken nuclei range Accumulation range Mechanically generated aerosol range 0.002 0.01 0.1 1 2 10 100 Fine particles Coarse particles Size distribution of aerosols in the atmosphere
Normally fine Normally coarse Variable Sulphates Carbon soot Organic compounds Water Lead Ammonium Arsenic Selenium Mercury Iron Calcium Titanium Magnesium Aluminium Silicon Potassium Phosphate Chromium Chloride Nickel Tin Vanadium Copper, Lead Zinc Antimony Manganese Chromium, Cadmium Size ranges that commonly found chemical constituents in atmospheric aerosol Source: as cited in Sharma (1994)
Gaseous pollutant Industry SO2 NOx Suspended particulate matter automobile transformation Secondary particle deposition extinction Sea salt soil Industrial smoke Nature of the suspended particle matter
Elemental concentration SPM in the air Si Al Fe V Ni Cr Na Cl contribution Sea salt soil Na Cl Si Al Fe V Ni Cr industry elemental composition for 2nd source category elemental composition for 3rd source category Relationship between the emission source and suspended particulate matter (SPM) in the air elemental composition for 1st source category
The chemical components concentrations at one receptor site The concentrations contributed by each emission source type Elemental compo- sition for each source category j Fundamental of Receptor Model Chemical Mass Balance (CMB) Receptor data (given) Target to be estimated Source profile (given) [Sjk] [Cik] [aij]
Chemical Mass Balance Ci : ambient concentration of species i fi,j : fraction of species i in source j : uncertainty Sj : source contribution of source j effective variance weighted least squares regression Curtsey to Prof. Armistead Russell, GIT, USA
Determination of Source Profiles Diesel Biomass Soil Automobile Often use metals in PM as well. Curtsey to Prof. Armistead Russell, GIT, USA
Source profile of Okamoto et al. (1990) (unit : %)
Marker Elements Emission source Al*, Si*, Sc*, Ti, Fe, Sm, Ca Ca*, Al, Sc, Si, Ti, Fe, Sm Na*, Cl, Br, I, Mg, Na+, Mg2+ V*, Ni*, S, (SO4)2- Al, Sc, Se, Co, Ti, Th, S V, Na, Al, Ca, Mn Mn*, Cr*, Fe, Zn, W, Rb Zn, Cu, As, Sb, Pb, Al Sb, As, Pb Soil Road dust Sea salt Oil burning Coal burning Fly ash Ion and Steel industries Non-Ferrous metal industries Glass Industry Cement Industry Refuse Incineration Straw burning Automobiles Secondary aerosols Ca* K*, Zn*, Pb, Sb, Cu, As, Cl-, Br-, Cd K*, C*ele, C*org, Br C*ele, Br, Ce, La, Pt, (SO42-, NO3-) (SO42-*, NO3-, NH4+, ) Marker elements associated with various emission source * : Important elements for receptor model
PAH as alternative tracers for motor vehicle emissions Automobile traffic BaP, BghiP, Cor
Limitation of CMB method • Since CMB method use the statistical properties of the chemical composition data, we can not know more than the statistical inference. • If the sufficient number of marker elements was not analyzed, and/or sampling error and analyzing error are large, the estimated contribution for each emission may be questionable. • If we have more than two emission sources, and they discharge the particulate matters, which have similar chemical composition, we can not separate the contributions for there sources.
Multivariate Methods: Factor Analysis Background: 1. Because of the nature of atmospheric processes and meteorology, the concentrations of individual air pollutants will often vary simultaneously and this occurs irrespective of the sources. 2. The difficulties in differentiating individual sources due to similar marker elements The objective of multivariate methods is to detect the common variability after the fact and imply source identity by comparing the elements with common variability to the elements associated with specific sources.
Factor Analysis-Multiple Regressionmodel FA-MR model has its advantage in identifying the source categories present at the receptor sites even when information regarding the emission sources are insufficient. FA: To identify sources of PM and to select sourceemission tracers by grouping the selected variables according to their common variations. The principle is to find a minimum number of factors that explain most of the variance of the system. MR: To obtain a quantitative relationship between the source tracers and particle mass concentration.
RELATION BETWEEN FACTOR ANALYSIS AND CMB MODELS The fundamental relation between the concentration at a receptor site and source information can be expressed as where Cik is the concentration of element i in sample k and aij is the composition of element i of source j; the fractional abundance of element i in the j-th source profile, Sjk, is the contributing mass concentration (contribution) by the j-th source to sample k. The basic model for a factor analysis is of the form
The chemical components concentrations at one receptor site The concentrations contributed by each emission source type Elemental compo- sition for each source category j RELATION BETWEEN FACTOR ANALYSIS AND CMB MODELS Receptor data (given) Target to be estimated Source profile (given) [Sjk] [Cik] [aij] Factor score Factor loading
Application of Factor Analysis-Multiple Regression for PM Source Apportionmentin Bangkok urban area in 1996
Objectives To identify and quantitatively estimate the source contribution of airborne PM pollution in Bangkok urban air using a combination of PAHs and elemental compositions as a useful tracer in FA-MR model
Summary of sampling conditions Sampling Sampling Flow rate Particle Sampling Collection Species method period (l/min) Size range duration substrate determined m ( m) Andersen Dec.1996 28.3 0.43-11.0 24 hours Pallflex PAHs Sampler I ~ T60A20 Feb.1997 filter Andersen -ditto- -ditto- -ditto- One week Cellulose Elemental Sampler II nitrate components membrane filter Hi-volume -ditto- 980-1000 100 or less 24 hours -ditto- -ditto- Sampler I Hi-volume -ditto- -ditto- -ditto- -ditto- Quartz Org.&inorg. Sampler II Fibre filter carbons and Ionic species Number of samples 47
Stage 0 11 microns and above Gasket Air 7.0 - 11 microns Stage1 4.7 - 7 microns Stage 2 Stage 3 3.3 - 4.7 microns Collecting Plate Stage 4 2.1 - 3.3 microns 1.1 - 2.1 microns Stage 5 Stage 6 0.65 - 1.1 microns Stage 7 0.43 - 0.65 microns Back up Filter 0.43 microns and below Exhaust pipe Particle size separation unit Andersen Sampler Polypropylene rubber tube inner f = 1.2 cm 12 g 5 g Inlet inner f = 2.7 cm 4 cm 7 cm 14 cm 4 cm Glass wool pesticide grade XAD - 2 adsorbent Dimension of XAD-2 adsorbent tube
exclude unreliable samples • exclude measured variables close to the limit of • detection • select PAHs with MW 252, as they are • predominant in the particulate phase • (results of task I) • correlation matrix between variables should be high DATA SCREENING 47 samples 44 variables 42 samples 23 variables N > 30 + (v + 3)/ 2
Concentration Data FACTOR ANALYSIS Factor Loading Factor Score Calculation of Absolute Factor Score Estimate probably major source contributed to the receptor site Multiple Regression Source Contribution Principle of FA-MR quality model, version 1.0
FA-MR MODEL CALCULATION • Calculate correlation matrix • Calculate Eigenvalue • Calculate Factor Loading • Calculate Absolute Factor Score • Regression analysis for estimating the mass • concentration by using AFS as the predictor variable • Estimate the new factor loading related to the • source composition
Results of Factor Analysis FactorsPrevail variables inProbable source type Factor loading Factor 1 Al, Sb, Sm, As, Ca, Fe, Soil & road dust Pb, Mn, SO42- Factor 2 Cu, Fe, BeP, BkF, BaP, Automobiles DBahA, BghiP Factor 3 Cr, Mn, Na, V, Zn, Industry & Sea salt Cl-, SO42- Factor 4 Zn, Pb, Corg, Cele Refuse incineration & open burning Factor 5 As, SO42-, DBahA, Cor Secondary pollutants
Results of multiple regression analysis [ SPM = Z1 (AFS)1 + Z2 (AFS)2 + Z3 (AFS)3 + Z4 (AFS)4 + Z5 (AFS)5 ]
Results of multiple regression analysis [ SPM = Z1 (AFS)1 + Z2 (AFS)2 + Z3 (AFS)3 + Z4 (AFS)4 + Z5 (AFS)5 ] The multiple correlation coefficient = 0.79
CONCLUSIONS The results of FA-MR model revealed a consistency of PM pollution sources in Bangkok urban air in which soil and re-entrained road dust as well as automobiles were the major contributors. Besides, the results of Factor 2 revealed that air pollution by airborne PAH in Bangkok were mostly from automobiles exhaust.