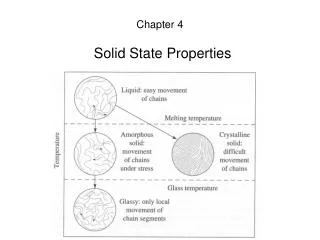
Solid State Properties
Chapter 4. Solid State Properties. Polymer Phases. Viscous Liquid. Polydimethylsiloxane T g = -123°C; T m = -40 °C. Elastomeric Polyisoprene T g = -73 °C Polybutadiene, T g = -85 °C Polychloroprene, T g = -50 °C Polyisobutylene, T g = -70 °C. Semi- Crystalline.
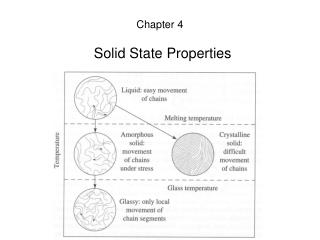

Solid State Properties
E N D
Presentation Transcript
Chapter 4 Solid State Properties
Polymer Phases Viscous Liquid Polydimethylsiloxane Tg = -123°C; Tm = -40 °C Elastomeric Polyisoprene Tg = -73 °C Polybutadiene, Tg = -85 °C Polychloroprene, Tg = -50 °C Polyisobutylene, Tg = -70 °C Semi-Crystalline Nylon 6,6, Tg = 50 °C; Tm = 265 °C Poly ethylene terephthalate, Tg = 65 °C; Tm =270 °C Amorphous Glassy Polystyrene Tg = 100 °C Polymethyl methacrylate, Tg = 105 °C
Amorphous plastics have a complex thermal profile with 3 typical states: 9 8 7 6 5 4 3 Temperature Glass-rubber-liquid Polystyrene Glass phase (hard plastic) Leathery phase Tygon (plasticized PVC) Log(stiffness)Pa Rubber phase (elastomer) polyisobutylene Tg Liquid PDMS
Heat Distortion Temperature • The maximum temperature at which a polymer can be used in rigid material applications is called the softening or heat distortion temperature (HDT). • A typical test (plastic sheeting) involves application of a static load, and heating at a rate of 2oC per min. The HDT is defined as the temperature at which the • elongation becomes 2%. • A: Rigid poly(vinyl chloride) • 50 psi load. • B: Low-density poly(ethylene) • 50 psi load. • C: Poly(styrene-co-acrylonitrile) • 25 psi load. • D: Cellulose acetate • (Plasticized) 25 psi load.
Transient Testing: Resilience of Cured Elastomers • Resilience tests reflect the ability of • an elastomeric compound to store • and return energy at a given • frequency and temperature. • Change of rebound • resilience (h/ho) with • temperature T for: • 1. cis-poly(isoprene); • 2. poly(isobutylene); • 3. poly(chloroprene); • 4. poly(methyl methacrylate).
Polymer Family Tree Thermoplastics Thermosets/Elastomers Will reform when melted Will not reform Not Cross-Linked Cross-linked 90% of market 10% of market Polyethylene Epoxy 33% Melamine Formaldehyde Vinyls Phenolic 16% Polyester (unsaturated) Polypropylene Polyimide 15% Polyurethane PMMA Some are thermoplastic as well. ABS Silicone Nylon Urea Formaldehyde Polycarbonate Saturated Polyester PEEK Polyurethane Some are thermosets as well. PVC Types of Polymers
Ballpark Comparisons Tensile strengths Polymers: ~ 10 - 100 MPa Metals: 100’s - 1000’s MPa Elongation Polymers: up to 1000 % in some cases Metals: < 100% Moduli (Elastic or Young’s) Polymers: ~ 10 MPa - 4 GPa Metals: ~ 50 - 400 GPa
Amorphous v Crystalline Polymers Thermo-mechanical properties
Thermal Expansion If a part is to be produced within a close dimensional tolerance, careful consideration of thermal expansion/contraction must be made. Parts are produced in the melt state, and solidify to amorphous or semi-crystalline states. Changes in density must be taken into account when designing the mold.
Anatomy of a Stress Strain Graph /strain Elongation = 100% x Initial slope is the Young’s Modulus (E’ or sometimes G) TS = tensile strength y = yield strength Toughness = Energy required to break (area under curve)
Compression and Shear vs. Tensile Tests Stress-strain curves are very dependent on the test method. A modulus determined under compression is generally higher than one derived from a tensile experiment, as shown below for polystyrene. Tensile testing is most sensitive to material flaws and microscopic cracks. Compression tests tend to be characteristic of the polymer, while tension tests are more characteristic of sample flaws. Note also that flexural and shear test modes are commonly employed.
Stress Strain Graphs Chains in neck align along elongation direction: strengthening Elongation by extension of neck
Ductility & Elongation (EL) EL < 5% Brittle EL > 5% Ductile Thermosets = strong & brittle Not Ductile Thermolastics = depends on T
TENSILE RESPONSE: Stress-strain curves adapted from Fig. 15.1, Callister 6e. Inset figures along elastomer curve (green) adapted from Fig. 15.14, Callister 6e. (Fig. 15.14 is from Z.D. Jastrzebski, The Nature and Properties of Engineering Materials, 3rd ed., John Wiley and Sons, 1987.) • Compare to responses of other polymers: --brittle response (aligned, cross linked & networked case) --plastic response (semi-crystalline case) 25
Elastomer Molecules High entropy Low entropy Model of long elastomer molecules, with low degree of cross‑linking: (a) unstretched, and (b) under tensile stress. Low energy High energy
YOUNG’S MODULI: COMPARISON Graphite Ceramics Semicond Metals Alloys Composites /fibers Polymers E(GPa) Based on data in Table B2, Callister 6e. Composite data based on reinforced epoxy with 60 vol% of aligned carbon (CFRE), aramid (AFRE), or glass (GFRE) fibers. 13
Linear Elasticity: Possion Effect • Hooke's Law: = E • Poisson's ratio, : metals: ~ 0.33 ceramics: ~0.25 polymers: ~0.40 Units: E: [GPa] or [psi] n: dimensionless Why does have minus sign?
Poisson Ratio • • Poisson Ratio has a range –1 1/2 • Look at extremes • No change in aspect ratio: • Volume (V = AL) remains constant:V =0. • Hence, V = (L A+A L) = 0. So, • In terms of width, A = w2, then A/A = 2 w w/w2 = 2w/w = –L/L. • Hence, Incompressible solid. Water (almost).
Poisson Ratio: materials specific Metals: Ir W Ni Cu Al Ag Au 0.26 0.29 0.31 0.34 0.34 0.38 0.42 generic value ~ 1/3 Solid Argon: 0.25 Covalent Solids: Si Ge Al2O3 TiC 0.27 0.28 0.23 0.19 generic value ~ 1/4 Ionic Solids: MgO 0.19 Silica Glass: 0.20 Polymers: Network (Bakelite) 0.49 Chain (PE) 0.40 Elastomer: Hard Rubber (Ebonite) 0.39 (Natural) 0.49
Example: Poisson Effect • Tensile stress is applied along cylindrical brass rod (10 mm diameter). Poisson ratio is = 0.34 and E = 97 GPa. • Determine load needed for 2.5x10⁻³ mm change in diameter if the deformation is entirely elastic? Width strain: (note reduction in diameter) x= d/d = –(2.5x10⁻³ mm)/(10 mm) = –2.5x10⁻⁴ Axial strain: Given Poissonratio z= –x/ = –(–2.5x10⁻⁴)/0.34 = +7.35x10⁻⁴ Axial Stress: z = Ez = (97x103 MPa)(7.35x10⁻⁴) = 71.3 MPa. Required Load:F = zA0 = (71.3 MPa)(5 mm)2 = 5600 N.
Negtive poisson’s ratio • foams
Compression Radial n = -1.24 Axial n = 0 Lakes, R. S., "No contractile obligations", Nature, 1992, 358, 713-714.
Anisotropic Materials 1) Compaction of UHMWPE powder 2) Sintering 3) Extrusion
Mechanical properties are sensitive to temperature FIGURE 10.9 Effect of temperature on the stress-strain curve for cellulose acetate, a thermoplastic. Note the large drop in strength and increase in ductility with a relatively small increase in temperature. Source: After T.S. Carswell and H.K. Nason. Manufacturing Processes for Engineering Materials, 5th ed. Kalpakjian • Schmid Prentice Hall, 2008.
Ceramics Metals Stress Polymers Strain • Lower elastic modulus, yield and ultimate properties • Greater post-yield deformability • Greater failure strain
Polymers: Thermal Properties • In the liquid/melt state enough thermal energy for random motion (Brownian motion) of chains • Motions decrease as the melt is cooled • Motion ceases at “glass transition temperature” • Polymer hard and glassy below Tg, rubbery above Tg
Polymers: Thermal Properties Tg Tm semicrystalline log(Modulus) crosslinked linear amorphous Temperature
decreasing temperature or increasing crystallinity Stress Strain Polymers: Thermal Properties
Increasing cross-linking • Properties depend on amount of cross-linking Figure 8.13 M. P. Groover, “Fundamentals of Modern Manufacturing 3/e” John Wiley, 2007
Polymer Phases Polymers don’t exist in gas state; RT for boiling is higher than bond energies Glassy Solids Polystyrene Tg 100 °C PMMA Tg 105 °C Polycarbonate Tg 145 °C Rubber Tg -73 °C Liquid Volume Crystalline Solids Polyethylene Tm 140 °C Polypropylene Tm 160 °C Nylon 6,6 Tm 270 °C Glassy Solid Crystalline Solid Liquids Injection molding & extrusion Polydimethylsiloxane Tm -40 °C Tg Tm Tb Temperature
Viscous Response of Newtonian Liquids The top plane moves at a constant velocity, v, in response to a shear stress: A F Dx v y A There is a velocity gradient (v/y) normal to the area. The viscosityh relates the shear stress, ss, to the velocity gradient. The shear strain increases by a constant amount over a time interval, allowing us to define a strain rate: Units of s-1 The viscosity can thus be seen to relate the shear stress to the shear rate: hhas S.I. units of Pa s.
Measuring viscosities 1 pascal second = 10 poise = 1,000 millipascal second 10-100,000 cP Requires standards
Viscosity of Polymer Melts Shear thinning behaviour For comparison: h for water is 10-3 Pa s at room temperature. Poly(butylene terephthalate) at 285 ºC