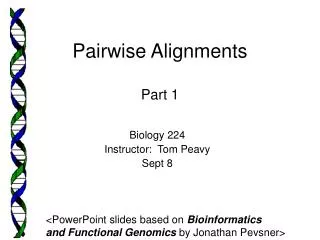
Pairwise alignments
Pairwise alignments.
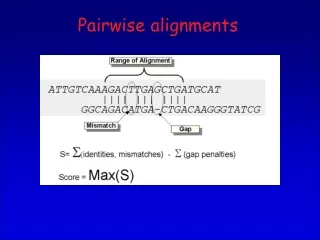

Pairwise alignments
E N D
Presentation Transcript
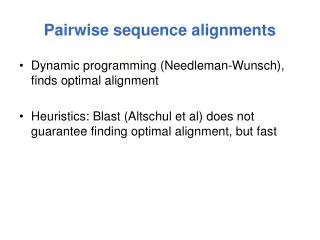
A heuristic search method; seeks words of length W (default 3 in blastp) that score at least T when aligned with the query and scored with a substitution matrix. Words in the database that score T or greater are extended in both directions in an attempt to find a locally optimal ungapped alignment or HSP (high scoring pair) with a score of at least S or an E value lower than the specified threshold. HSPs that meet these criteria will be reported by BLAST, provided they do not exceed the cutoff value specified for number of descriptions and/or alignments to report.
BLAST Algorithm - Input Parameters • W the length of the words for which we are looking for almost exact matches (Default W = 11 or 3). • Expect- The number of different alignments with scores at least S that are expected to occur in a database search by chance.(Default E = 10). • The score distribution follows the extreme value distribution: E= Kmne-S • K and are scales forsearch space size and scoring system, respectively. • n is the length of the query sequences, m is the size of the database (all sequences concatenated). • Intuition: doubling m or n doubles the number; doubling the score causes exponential decrease. • Lower EXPECT thresholds are more stringent, leading to fewer matches reported.
Gap Models • Gap: any maximal consecutive stretch of spaces in a single sequence in a given alignment.Example:alignment S= ATTC--GA-TGGACC • T= A--CGTGATT--- CC 4 gaps • Motivation: • Indels create gaps. • cDNA matching involves gaps. Gap penalty types - examples: • Constant - cost is independent of number of spaces. • Affine - combined of a cost for opening a gap, and a cost for each extra space within the gap.
PROTEOMICS The Study of Proteins. Pairwise Alignments.
Jellyfish green fluorescent protein Spider webs Fireflies light Rhino horn Cobra’s venom Also: feathers, porcupine quills, fingernails, wool, scales tortoise shells etc.
What are Proteins ? • Proteins are abundant molecules, found • in all organisms and form the very basis of life. • Proteins are polypeptides,made of amino acids chains. • There are 20 amino acids (building blocks). • The amino acids are linked bypeptide bonds. • The amino acids differ in theirside chain. • The genetic code – each amino acid is coded by 3 nucleotides, named codon.
The Genetic Code • The genetic code - Each amino acid is coded by 3 nucleotides, named codon. • Code redundancy - Most amino acids are coded by several codons. • - 64 triplets code for 20 amino acids & 3 stop codons.
Amino Acids - the building blocks of proteins: From: The structure of life. (NIH and National Institute of General Medical Sciences) www.nigms.nih.gov Side chains Glycine (hydrophilic) Asparagine (amides) Phenylalanine (aromatic) Methionine (hydrophobic)
Chemical Similarities Between Amino Acids: Acids & Amides DENQ (Asp, Glu, Asn, Gln) Basic HKR (His, Lys, Arg) Aromatic FYW (Phe, Tyr, Trp) Hydrophilic ACGPST (Ala, Cys, Gly, Pro, Ser, Thr) Hydrophobic ILMV (Ile, Leu, Met, Val)
Allowable Amino Acid Substitution Groups http://www.imb-jena.de/IMAGE_AA.html
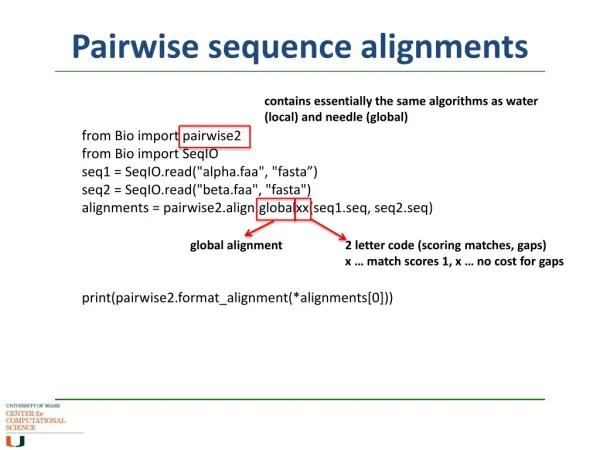
Protein Pairwise Sequence Similarity • The alignment tools are similar to the DNA alignment tools • BLASTP, FASTA, PSI-BLAST • Main difference: instead of scoring match (+1) and mismatch (-2) we have similarity scores: • g(a,b) is high if amino acids a and b have similar properties (> 0) • g(a,b) is low otherwise ( 0)
similarity identity
Scoring Matrices • A matrix of 20x20 entries • Entry (i,j) is the score of aligning amino acid i against amino acid j. • Entry (i,j) is equal to entry (j,i) • scoring matrices are symmetric • Entry (i,i) is greater than any entry (i,j), ji.
Log-odds • Scoring matrices in general can be written as: • Sij = • where: • qij – target frequency. Sum over all j of qij = 1. • pi – background frequencies. Score Frequency of substitution >0 more frequent than expected =0 as expected <0 less frequent than expected • Background frequency is easy to compute. • Target frequency – different between methods. • Most common scoring matrices - PAM and BLOSUM.
PAM - Point (Percent) Accepted Mutations • Developed by Margaret Dayhoff, 1978. • A model for protein evolution: Analyzed very similar protein sequences. • Proteins are evolutionary close. • Alignment is easy. • PointMutations, mainly substitutions • Accepted mutations by natural selection. • Found that common substitutions occurred • Involving chemically similar amino acids.
PAM Distance and Matrix A measure of likelihood of amino acid replacement developed by counting the number of substitutions of each amino acid pair. 1PAM unit = an average change in 1% of all amino acid positions PAM1 matrix - the likelihood of replacement during 1PAM unit. PAMn can be derived from PAM1 (Markov chain) • in step 1 amino acid a changes to b using PAM1(a,b) • in step 2 amino acid b changes to c using PAM1(b,c) • …
PAM or Dayhoff Family of Matrices. (The log odds matrix for PAM 250) • Similar amino acids are close to each other. • Regions define conserved substitutions. • Correspond to sequences that are about 20% identical.
PAM - Rules of Thumb • When there is no information about evolutionary distance, 3 approaches are recommended for sequence comparison: • PAM 40, PAM 120 and PAM 250. • The PAM matrix for aligning two sequences should match their estimated evolutionary distance: • PAM 250 - sequences that are 20% similar • PAM 120 - 40% similar • PAM 80 - 50% similar • PAM 60 - 60% similar • Low PAM numbers:short sequences, strong local similarities. • High PAM numbers:long sequences, weak similarities.
BLOSUM - Blocks Substitution Matrix • Developed by Henikoff & Henikoff, 1992. • Examined multiple alignments of distantly related protein regions directly (not extrapolating from closely related sequences). • Based on the BLOCKS database (www.blocks.fhcrc.org) • Families of proteins • Family members have identical biochemical functions • Aligned the members and found common motifs • common blocks of local alignment • Counted the amino acid replacements within the blocks.
BLOSUM - Blocks Substitution Matrix AABCDA… BBCDA DABCDA. A.BBCBB BBBCDABA.BCCAA AAACDAC.DCBCDB CCBADAB.DBBDCC AAACAA… BBCCC First column: AABACA Pairs count: 6 AA, 4 AB, 4 AC, 1 BC, 0 BB, 0 CC; 15 total. qi,j = number of ij pairs/ total number of pairs (qA,B = 4/15). pj =probability of i appearancespi =qi,i + qi,j/2 ei,j = expected probability of pair ij ei,j = 2 pi pj; ei,i = pi pi The matrix values are log (observed / expected) log2(qi,j / eij)
THE BLOSUM Family of Matrices. BLOSUMN is based on sequences that are at most N percent identical. (The log odds matrix for BLOSUM 45)
PAM Verses BLOSUM: • PAM is based on an evolutionary model. • BLOSUM is based on protein families. • PAM is based on global alignment • BLOSUM is based on local alignment. • PAM is for tracking evolutionary origin of proteins • BLOSUM is designed to find their conserved regions.
Other Scoring Matrices • Scoring matrices for sequence alignment can be based on the following criteria: • genetic code changes - the number of changes required to transform one codon to another. • Chemical properties similarity - volume, polarity,.. • Structurally similar protein sequences • Specific protein family matrix, e.g., trans-membrane proteins. • Matrices that employ neighboring amino acids.
http://www-bioeng.ucsd.edu/research/research_groups/compbio/workshop/http://www-bioeng.ucsd.edu/research/research_groups/compbio/workshop/
Principles for Protein Similarity Search: • Use BLOSUM 62 or PAM 120 and default gap penalties. • If no significant results, use BLOSUM 30 or PAM 250 and lower gap penalties. • Examine results between EXP. 0.05 and 10 for significance. • PSI-BLAST for protein families.
PSI-BLAST • Position Specific Iterated BLAST • Finds more distantly related sequences than FASTA or BLAST. • Upon aligning a group of sequences, the vector of characters in a certain column is called a profile. • Conserved regions - regions that are very similar (have profiles with little variance). • 1 2 3 4 5 6 7 • SAGSTGH • TAGSTAA • TCGSTCC GCT is a conserved region
PSI-BLAST Contd. A protein family contains conserved regions. These define the structure and function typical for this family. We would like the alignment score to consider how conserved a column is. PSI BLAST gives high scores to matches within conserved regions.
PSI-BLAST - (Position Specific Iterated BLAST) • Aniterative searchin which sequences found in one round of searching are used to build a score model for the next round of searching. • Why use PSI-BLAST ? • An important tool for predicting both biochemical activity & function. • Identify week homologies (distant relatives of a proteins, which are not found in FASTA or BLAST). Information: http://www.ncbi.nlm.nih.gov/Education/BLASTinfo/psi1.html
How Does PSI-BLAST Work ? 1. Compare the query sequence to database (gapped BLAST). Construct profile from significant alignment Note:A highly conserved position will receive a high score and weakly conserved positions receive scores near zero. 3. Compare the profile to database. Repeat steps 2 & 3 (“iterations”)until no new significant sequences are found ("convergence”).
PSI-BLAST Search: • Hits that are better than the E-value threshold are listed first. These hits are used in forming the profile that will be used in subsequent PSI-BLAST iterations. • Hits with E-values worse than threshold, but nonetheless have an E-value better than 10 (default; selected on the query page) are listed further down the page. • Any of the sequences in the list of "Sequences with E-value worse than threshold” (>0.005) can be manually added (click) to sequences used for generating the PSI-BLAST profile.
www.expasy.ch/sprot Databank of protein sequences, for both existing and putative proteins. Hbb human
TaxBLAST: Organism Report Common name Blast name Scientific name BLAST hits are sorted according to the species of the target sequence. All the hits of the same organism will appear together. Within each species, the BLAST hits are sorted by score.
Lineage Report How close are organisms in the BLAST hitlist related to query sequence ? Taxonomy Report http://www.ncbi.nlm.nih.gov/Taxonomy/tax.html/
Other BLAST Options: RPS-BLAST-A program that compares a protein sequence against the Conserved Domain Database (SmartandPfam),may provide functional identifications. PHI-BLAST- (Pattern Hit Initiated BLAST)can locate other protein sequences that contain the expression patterns and are homologous to the query protein sequence.
Function - Structure Relationship • Protein function depends on the protein 3D structure • example: zinc-finger proteins. • Protein structure provides insight into protein function. • How does a protein fold into its native structure?
Sequence - Structure Relationship • Early renaturation experiments have shown that the sequence of the protein is sufficient to determine its structure (Anfinsen, 1973). • A major challenge in bio-informatics -Prediction of protein structure from its sequence.