Download
1 / 15
150 likes | 170 Vues
Explore the challenges faced, performance analysis, budget allocation, and monitoring capacity of the Western Cape Department of Local Government and Housing. Gain insights into expenditure, backlog, and construction progress.

E N D
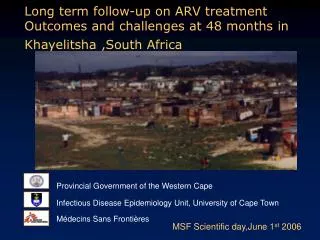
PORTFOLIO COMMITTEE ON HOUSINGPublic Hearings : GrantExpenditure 2004/05, Expenditure 2005/06, Budget 2006/07 Department of Local Government and Housing Provincial Government of the Western Cape 9 May 2006
CONTENTS • Challenges • Performance 2004/05 • Performance 2005/06 • Budget 2006/07 • Monitoring Capacity • Constraints
Challenges: To existing funding • Backlog of >300,000 units • Reality?<15,000 units can be built with annual grant (05/06 = R456m)
2. Performance 2004/05 • 87% of available funds spent • R 511m spent • Available funds : R 446m grant R 141m roll-over from 03/04 TOTAL R 587m R77m rolled over to 2005/06 • 13 618 houses built and 16 965 sites serviced
3. Performance 2005/06 • 100% of available funds spent • R 573m spent : • Available funds : R 456m grant R 77m rollover R 40m Provincial Funds • 16,053 houses built and 18,412 sites serviced
Actual Expenditure: 2005/06 * OVER SPENDING DUE TO THE PROVINCIAL OWN FUNDING OF R40m (N2 PROJECT)
Actual Expenditure: Metro/Districts 2005/06 • ExamplesP • O • Cape Town: 89 % of R 416m (R 371m) • Cape Winelands: 86% of R 48m (R 41m) • Overberg: 100%+ of R19m (R 26m) • Central Karoo: 100%+ of R 3m (R 23m) • Eden: 100%+ of R 32m (R 55m) • West Coast: 100%+ of R 10m (R 17m) • Provincial own funding : R40m (N2 project)
Cape Winelands District 2005/06 & 2006/07 (Example) Allocation2005/06 Actual Exp Allocation2006/07 % Breede River/Winelands 4,680,518 32% 1,518,102 5,555,000 Breede Valley 13,662,432 5,815,099 43% 43,500,000 Drakenstein 12,871,424 10,803,200 84% 15,276,000 Stellenbosch 12,871,424 10,868,780 84% 14,000,000 Witzenberg 12,257,553 100% 9,750,000 3,510,388 0 0% 139,000 117,013 Cape Winelands District TOTAL 47,713,199 41,262,734 86% 88,220,000
Budget 2006/07 • 06/07 allocation of R599m • Objective is to spent 2006/07 budget by December 2006 • Amount spent in April 2006 is R51m vs R6.5m in 2005/06
Rationale for new allocations (2006/07) • Needs survey in Provincial Housing Plan • Prioritised to provincial areas of highest need(Breaking New Ground / PSDF) • Existing budget constraints • Past performance in municipal area(Existing / planned commitment) • Projects prioritized in municipal IDP
Allocation : Metro/Districts 2006/07 • ExamplesP • O • Cape Town: 335,037 • Cape Winelands: 88,220 • Overberg: 44,301 • Central Karoo: 12,639 • Eden: 44,681 • West Coast: 26,940 • Other Allocations: 35,006
4. Monitoring Capacity • Provincial Department has a well functioning team of engineers, project managers and inspectors to monitor the various municipal projects. • Monthly reports on the key indicators. A) Sites serviced. B) Houses built C) Expenditure • Capacity for implementation within Municipalities is in many cases insufficient. • Provincial Department has set up a directorate of Monitoring and Evaluation to coordinate monitoring of all municipal delivery indicators.
5. Constraints • Social Housing: Implementation delayed – particularly funding arrangements • All new programmes to be funded from same grant – no increase for new programmes • Late notification of new subsidy quantum ( end March – just in time for new financial year) - delivery delays,adjustment of contract amounts
Thank You Department of Local Government and Housing Provincial Government of the Western Cape