Analyzing Absolute Metabolite Concentrations in Brain Tissue Using Gaussian and Lorentzian Functions
120 likes | 281 Vues
This presentation discusses methods for obtaining absolute metabolite concentrations in brain tissue by utilizing Gaussian and Lorentzian functions. It covers the creation of a noise-free baseline using anchor points on the spectrum, the identification of metabolite peaks, and the application of mathematical models for peak integration. Both Gaussian and Lorentzian functions are compared in terms of their effectiveness, with results indicating that both models yield similar metabolite ratios. Attendees are encouraged to provide suggestions or feedback on the findings.

Analyzing Absolute Metabolite Concentrations in Brain Tissue Using Gaussian and Lorentzian Functions
E N D
Presentation Transcript
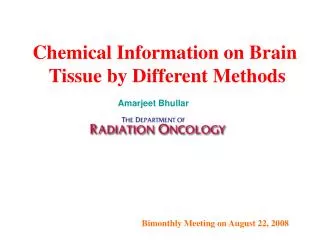
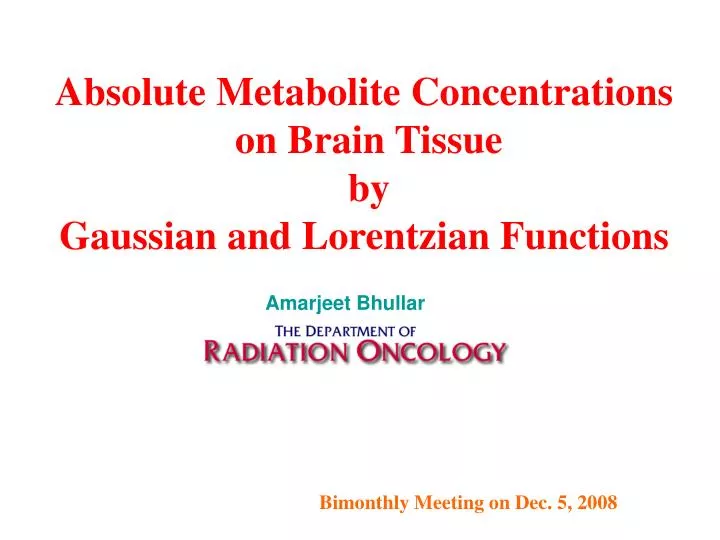
Absolute Metabolite Concentrations on Brain Tissue by Gaussian and Lorentzian Functions Amarjeet Bhullar Bimonthly Meeting on Dec. 5, 2008
How to get absolute signal? Absolute Signal = Raw data - Noise Raw data = Real Spectrum without any manipulation Noise = Draw a Baseline using few anchor points on Spectrum Noise=Baseline is determined by interpolating anchor points on spectrums.
Absolute Metabolite Concentrations • Create baseline using few anchor points on spectrum. • Find metabolite peaks. • Fit Mathematical function on metabolite peaks. • Integrate peaks between the limits to calculate absolute metabolite concentrations.
Integral of Gaussian Function : Error Function Error Function Numerically: Codes developed in C and Mathematica 6.0
Conclusion: Both mathematical models have produced the same ratios. Suggestions are welcome