
Example: Shuttle Missions
E N D
Presentation Transcript
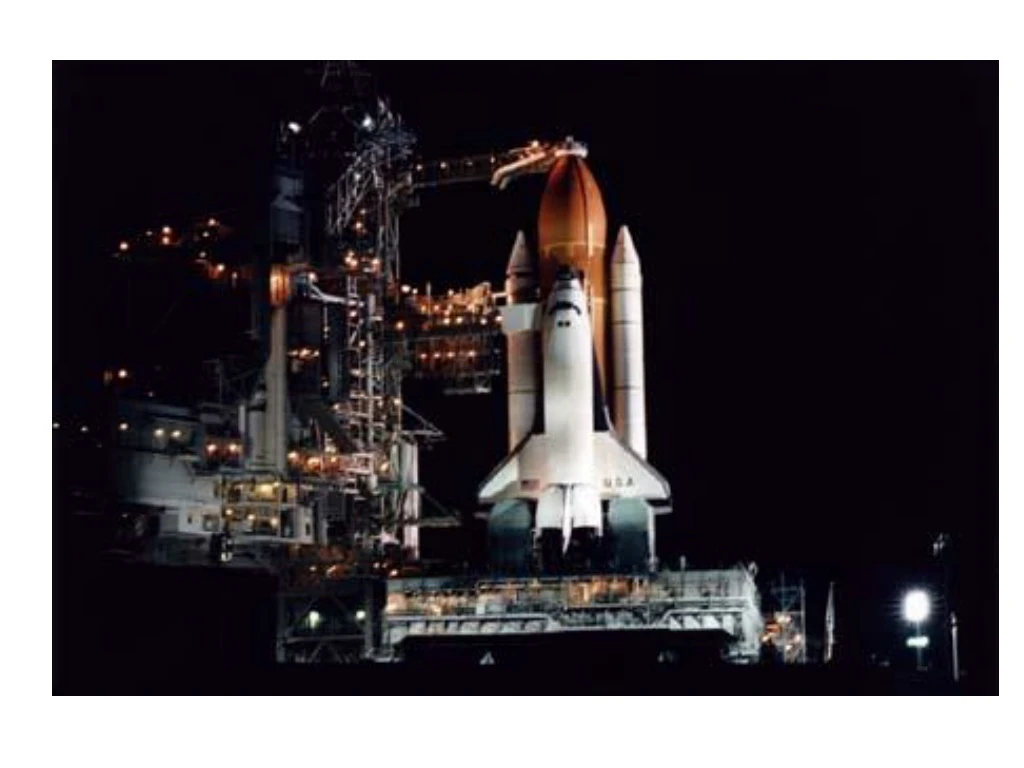
Example: Shuttle Missions • O-rings failed in Challenger disaster • Low temperature • Prior flights “erosion” and “blowby” in O-rings • Feature: Temperature at liftoff • Target: problem (1) - erosion or blowby vs. no problem (0)
Data Shuttle; input Atrisk failed temp LCpress launch; *; label temp= "Temperature at Liftoff"; label launch = "Launch number"; label LCpress = "Leak Check pressure (PSI)"; cards; 6 0 66 50 1 6 1 70 50 2 (more data) proc logistic data=shuttle; title3 "Logistic Regression"; model failed/atrisk = temp launch; output out=out1 predicted = p; run; proc genmod data=shuttle; title3 "Logistic Regression"; model failed/atrisk = temp launch/dist=binomial; run;
Chi-Square Contingency Tables Heart Disease No Yes Heart Disease No Yes 100 100 Low BP High BP DEPENDENT INDEPENDENT
c2 Test Statistic • Expect 100(150/200)=75 in upper left if independent (etc. e.g. 100(50/200)=25) Heart Disease No Yes Low BP High BP 100 100 2(400/75)+ 2(400/25) = 42.67 Compare to c2 Tables Significant! 150 50 200 Distribution: Chi-square df=(rows-1)(cols-1)


