Download
1 / 16
160 likes | 306 Vues
Linda Newman Head of Digital Collections and Repositories University of Cincinnati Libraries Linda.Newman@uc.edu http://digitalprojects.libraries.uc.edu. Creative Re-Use of geographic and historical data and documents.

E N D
Linda Newman Head of Digital Collections and Repositories University of Cincinnati Libraries Linda.Newman@uc.edu http://digitalprojects.libraries.uc.edu Creative Re-Use of geographic and historical data and documents
The University of Cincinnati Libraries has been able to re-use records and digital objects in our repository (http://drc.libraries.uc.edu) with map data presented through Google Fusion tables, with timelines that direct users to our repository but are presented in a web interface; and by presenting data sets for an historical archive of 19th century records, allowing the potential for researchers to discover new knowledge while reviewing the online archive.
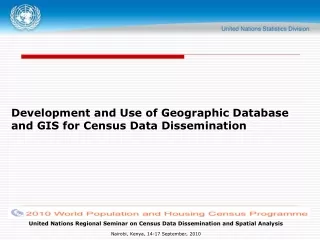
Map links take the user directly to a set of records in the Sabin archive of correspondence or photographs relevant to the selected country.
A similar map (again using Google Fusion Tables) will allow users to visually see the route of the fabled, never finished Cincinnati subway project from the 1920’s, and link directly to related images.
A glimpse of the table (a Google ‘Fusion’ table) in Google that is used to build the Sabin map.
A javascript that uses a Google spreadsheet also drives an interactive timeline on a web site that promotes the Sabin Archives.
<!--sabin timeline script--> <script type="text/javascript"> var timeline_config = { width: '900', height: '640',<!--needs to be worked with to show pictures correctly--> source: 'https://docs.google.com/spreadsheet/pub?key=0AgOq17Q728RjdGt0Y3V1bzd1Mk5lNUNTV3dvMVdDRUE&output=html', embed_id: 'timeline-embed', //OPTIONAL USE A DIFFERENT DIV ID FOR EMBED start_at_end: false, //OPTIONAL START AT LATEST DATE start_at_slide: '0', //OPTIONAL START AT SPECIFIC SLIDE start_zoom_adjust: '3', //OPTIONAL TWEAK THE DEFAULT ZOOM LEVEL hash_bookmark: false, //OPTIONAL LOCATION BAR HASHES font: 'css/fonts/PlayfairDisplay-Muli.css',//OPTIONAL FONT debug: true, //OPTIONAL DEBUG TO CONSOLE lang: 'es', //OPTIONAL LANGUAGE maptype: 'watercolor', //OPTIONAL MAP STYLE css: 'css/timeline.css', //OPTIONAL PATH TO CSS js: 'scripts/timeline-min.js' //OPTIONAL PATH TO JS </script> <script type="text/javascript" src="scripts/storyjs-embed.js"></script> <!--end sabin timeline script--> A javascript and a Google spreadsheet are used to create an interactive timeline with links to the repository.
This interactive timeline can be found at http://sabin.uc.edu, which in turn links to the Sabin Archives in our repository.
The Google map and the interactive timeline both offer graphical discovery tools for what otherwise is a rather dry archive of 30,000 letters and 1000 photographs found at http://drc.libraries.uc.edu/handle/2374.UC/664209.
Using Google Fusion tables and Google spreadsheets – combined with jquery, javascript, etc. – not too difficult – but our content creators really want the tools to create web exhibits to be directly linked to our repositories.
We are digitizing the ledge books of The House of Refuge, a juvenile detention center in Cincinnati in the 19th century. These ledger books were the ‘spreadsheets’ of the day, and show age of arrestee, parentage (race), reason for arrest, etc.
Our solution is to present the transcribed data as a spreadsheet (csv and xml), linked to the same record as the pdf with the images of the ledger books.
Content curators need to be able to create interactive, graphic exhibits that provide visual entrances to our repositories. Datasets need to be able to be analyzed and visualized. These techniques may offer a fore-shadowing of the kinds of services, for both data and text mining and visualization, that should be either embedded in our repositories, or made available as external tools if we have a fully featured API for our repositories. Repository managers must still primarily be concerned with ingest, organization and long term preservation, which is why the latter approach may be the most viable in the near future.
Creative Re-Use of geographic and historical data and documents Linda Newman Head of Digital Collections and Repositories University of Cincinnati Libraries Linda.Newman@uc.edu http://digitalprojects.libraries.uc.edu