Evaluating Wisconsin’s Safe and Supportive Schools Program: Key Findings and Insights
260 likes | 386 Vues
This document provides a comprehensive overview of the evaluation of Wisconsin’s Safe and Supportive Schools (S3) Program. Conducted by researchers from the University of Wisconsin-Madison, it aims to identify areas of school safety and support, document improvements in essential school outcomes over time, and evaluate intervention strategies and their effectiveness. The evaluation applies complex statistical modeling to analyze the relationship between intervention strategies and various measures, including student achievement and school climate, to enhance accountability and decision-making for future program improvements.

Evaluating Wisconsin’s Safe and Supportive Schools Program: Key Findings and Insights
E N D
Presentation Transcript
Evaluating Wisconsin’s Safe and Supportive Schools Program • D. Paul Moberg, PhD • Daphne Kuo, PhD • University of Wisconsin-Madison • Population Health Institute • December 7, 2012
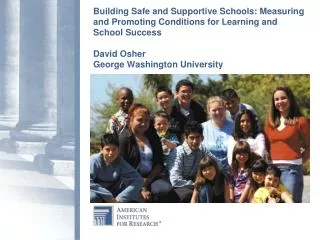
Overview of S3 Evaluation Evaluation Goals • Identify areas of relative safety and support(student perceptions) in each participating school • Document improvement over time in seven areas of school safety and support, and in academic and behavioral outcomes • Identify, code and describe intervention strategies (including curriculum, programs, and policies) • Evaluate effectivenessof the program--explore the relationships between intervention strategies, student achievement, behaviors (suspension and expulsion rates), and school climate (including the seven dimensions of school safety scores).
Evaluation Approach Useful--Support program decision-making, improvement and accountability (advice?) Evaluation Design • Change over time within S3 schools and in aggregate • Comparison high schools (available indicators-- suspension, expulsion, graduation, achievement test scores; oYRBS where available) • Complex statistical modeling—students nested in schools, controls for population characteristics; mediators and moderators; propensity scores
Process Evaluation Process Measures • Annual Reports from S3 schools • Changes in school policy • School programs implemented • PBIS Implementation? Would like Input: • What data are available on implementation with minimal burden to school staff ? • Should annual report be supplemented with a survey?
Outcome Data Measures: • DoE Required S3 Index—”School Safety Score” • oYRBS—S3 Module (annual over 4 years) • Student Achievement (test scores, graduation)* • Behavioral Outcomes: (Suspensions, expulsions, behavioral incidents)* *WINSS trends over 6 years (2 before S3 baseline) measured at the school level
How do S3 Students compare to random sample of Wisconsin Students?
oYRBS Data • Factor Analysis 7 Indices • violence • bullying and harassment • alcohol and drug use • rule and discipline enforcement • general climate and support • general safety • Caution—These are student self reported behaviors and perceptions
Perceptions of Safe and Supportive School Environment 9th and 11th graders in 2012 Wisconsin S3 schools--oYRBS
Student Perceptions by Sexual OrientationRelative to Heterosexual (=0.0) n~18,000
What other analyses would help you? • Contact us: • Paul Moberg: dpmoberg@wisc.edu • (608) 263-1304 • Daphne Kuo: dkuo@ssc.wisc.edu • (608) 261-1154