Download
1 / 43
440 likes | 844 Vues
Transportation Engineering - I. Lec-8 Traffic Volume Counts and Road Accidents. Definitions. Count – number of vehicles/travelers passing a highway spot in a counting period Volume – number of vehicles/ travelers passing a highway spot per unit time

E N D
Transportation Engineering - I Lec-8 Traffic Volume Counts and Road Accidents
Definitions • Count – number of vehicles/travelers passing a highway spot in a counting period • Volume – number of vehicles/ travelers passing a highway spot per unit time • Capacity – maximum and repeatable volume of vehicles/travelers • Demand – volume not influenced by highway capacity
Capacity Demand Volume Congestion Definitions Traffic Intensity Time
Definitions Volume Traffic Intensity Time
AADT vs. ADT • AADT = Annual Average Daily Traffic (veh/day) • ADT = Average Daily Traffic (veh/day) represents periods other than a year • Weekly ADT, Monthly ADT
Seasonal Variability of Monthly ADT 128 % Counts in August on a rural road have given August Monthly ADT = 10,000 veh/h What is Annual ADT? AADT = 10,000∙(1/1.28) =10,000∙0.781 AADT = 7,810 veh/day 0.781 = Seasonal Factor (SF)
WeeklyVariabilityof Daily Volumes 0.158 Thursday daily traffic on a suburban arterial = 30,000 veh/day Weekly ADT = ? = 30,000∙(1/0.158/7) = = 30,000∙0.904 = Weekly ADT = 27,100 veh/day 0.904 = Weekly Factor (WF) Weekly ADT ≈ Monthly ADT
Seasonal and Weekly Variability of Daily Volumes Counts in average weekday in March, recreational road, in Minnesota, March Weekday ADT = 20,000 veh/day AADT=? AADT = 20,000∙(1/0.80) = 20,000∙1.25 AADT = 25,000 veh/day 1.25 = WF∙SF
Daily Variability of Hourly Traffic Vehicle counts on a local road on Wednesday between 4-7 PM gave total 2,350 vehicles Wednesday ADT = ? Counting Hour Percent of Daily Traffic 4-5 8.5 5-6 10.6 6-7 6.0 Total 25.1 Wednesday ADT = 2,350∙(1/0.251) = 2,350∙3.98 = 9,360 veh/h 3.98 = Daily Factor (DF)
AADT Estimation with Short Counts AADT = V·DF·WF∙SF where: AADT = Annual Average Daily Traffic, V = count in veh, DF = Daily Factor, WF = Weekly Factor, SF = Seasonal Factor, More than one day of counting (three days) and extended count periods each day are recommended
95% of volumes Day-to-day Variability of DailyProfile
AADT Estimation - Exercise • Vehicle counts have been conducted in mid March on Thursday between 3 and 5 PM. • Known: • Total count V=2,000 veh, • Volume between 3 and 4 PM equals 6 % of daily traffic • Volume between 4 and 5 PM equals 7 % of daily traffic • Thursday daily traffic equals 16 % of weekly traffic • March daily traffic equals 98 % of AADT • Calculate • Daily Factor DF • Weekly Factor WF • Seasonal Factor SF • AADT
AADT Estimation - Exercise • DF DF = 1/(Proportion of Daily Traffic) DF = 1/(0.06+0.07) = 7.69 • WF WF = 1/(Proportion of Weekly Traffic)/7 WF = 1/0.16/7 = 0.89 • SF SF = 1/(Proportion of AADT) SF = 1/0.98 = 1.02 • AADT AADT = V·DF·WF∙SF V = 2,000 vehicles AADT = 2,000∙7.69·0.89·1.02 = 13,800 veh/day
Design Volume Estimation Using Factor K • AADT in the horizon year (veh/day) • K = proportion of AADT during the 30th rank hour (other ranks may be used too) • D = directional split (busier direction) DHV = AADT·K·D
Alternative Estimation of Design Volume • Estimate AADT1 for the year with available vehicle counts, AADT1=V∙DF1∙WF1∙SF1 • Predict AADT2 for the future year using a growth factor AADT2=AADT1∙GF • Select month, day of week, and hour in the future year when the volume is likely to be close to the design volume • Convert the predicted AADT2 to the hourly volume for the hour selected in step 3, DHV=AADT2/DF2/WF2/SF2 • or DHV = V ∙ (DF1/DF2) ∙ (WF1/WF2) ∙ (SF1/SF2) ∙ GF
Short-Term Volume Variability Traffic performance is checked for the worst 15 minutes of the design hour
Peak Hour Factor Estimation of PHF PHF = Hourly Count/(4·Highest 15-min Count) Use of PHF Peak Volume Rate = DHV/PHF
Types of Volume Studies • Intersection counts (duration depends on the purpose, 15-minute intervals or shorter, turning volumes) • Pedestrian counts (duration depends on the purpose, 5-minute intervals or longer) • Cordon counts (one weekday + travelers’ survey) • Screen line counts (hourly counts for a weekday) • Area wide counts • Control counts (hourly counts with permanent stations) • Coverage counts (hourly counts for one or two days)
Counting Techniques • Manual counting • For one day or less • Turning volumes, pedestrians, test counts • Pencil and paper • Electronic manual recorders • Machine counting • For longer counting periods: one day or longer • Permanent stations (inductive loops, WIM) • Portable stations (pneumatic, inductive, magnetic, video, etc.)
Origin-Destination Studies • External (on the road) • Cordon studies • Roadside interviews • Postcard studies • License plate studies • Tag-on vehicle method • Lights-on studies • Transit passenger questionnaire
Origin-Destination Studies • Internal (off the road) • Dwelling unit interviews • Vehicle owner mail questionnaires • Interview at traffic generators (workplace, etc) • Truck and taxi surveys
Automatic Count Recording Methods • Automatic counts are recorded using one of three methods: portable counters, permanent counters, and videotape. • Portable counters serve the same purpose as manual counts but with automatic counting equipment. • The period of data collection using this method is usually longer than when using manual counts. The portable counter method is mainly used for 24-hour counts. • Pneumatic road tubes are used to conduct this method of automatic counts. • Permanent Counters • Permanent counters are used when long-term counts are to be conducted. The counts could be performed every day for a year or more. • Videotape • Observers can record count data by videotaping traffic. Traffic volumes can be counted by viewing videotapes recorded with a camera at a collection site
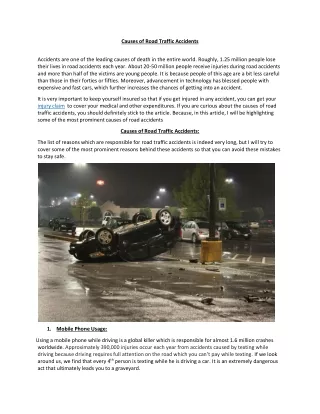
Disaster • Webster’s Dictionary defines disaster as • a baleful or fatal event leading to ruin. • Family • Country • What’s more disastrous for someone than the death of a relative following a road traffic accident.
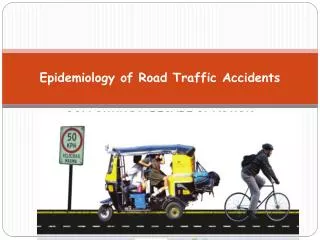
INTRODUCTION • Injuries account for 12% of the global burden of disease (1, 2) • Traffic accidents are costing countries between 1% to 2 % of their gross national product • Traffic accidents are a major preventable public health problem • About 1,2 millions persons were killed and 50 millions were injured, worldwide, in 2002.
DESCRIPTIVE EPIDEMIOLOGY Figure 2 : Road traffic injury mortality rates in the different regions of the world (1)
DESCRIPTIVE EPIDEMIOLOGY Worldwide • Road traffic injuries mortality rates : *1,2 millions persons killed every year * 3242 persons killed every day * Traffic accidents : 11th cause of death * Developing countries: - 2/3 of the world population - 90% of deaths due to road crashes
DESCRIPTIVEEPIDEMIOLOGY Worldwide • Road traffic injury mortality rates : * Increase in the mortality rates of 10% between 1990 and 2002 (1) * Differences between developped and developing countries Figure 3 : Changes in road crashes mortality rates according to countries (1)
RISK FACTORS The risk depends on four elements : • A) Exposure excess (need to travel) • B) Risk of crash, given a particular exposure, • C) Risk of injury, given a crash, • D) Risk of death or severe consequences, given an injury.
PREVENTION • Taffic accidents are preventable. • The three targets of the road safety actions : - the road users - the vehicles - the roads infrastructure as well as the traffic management.
B- The key organizations intervening in the prevention strategies : Figure 7 : Organizations intervening in road safety actions(1)
C- Prevention measures : Prevention strategies are made of interventions which are aiming to : • diminish the exposure risk. • avoid road crashes, given a particular exposure. • reduce the severity of injuries caused by crashes • improve the medical care for victims.
Measures avoiding road crashes, given an exposure • Speed limitation • Measures against « alcohol and driving » • Measures avoiding the drivers fatigue : • Measures ensuring pedestrian and cyclists safety • Prevention of traffic accidents implying young drivers • The prohibition of the use of hand-held mobile telephones while driving • More road visibility
Measures reducing the severity of injuries caused by crashes : a – The use of seat-belts • When used, the seat-belt reduce the risk of fatal or severe accident, between 40% and 65 % (1). • Making the wearing of safety belts compulsory improves their use rates. b- Use of helmets c- Availability of air bags
Actions improving post-crash injury outcome - pre-hospital mesures : * Bystanders : call for help, carry out simple acts to rescue victims, protect victims from an other accident * Larger access to emergency services * Better pre-hospital medical care - actions in the hospital :
CONCLUSION Traffic accidents constitute a huge public health problem: a man made disaster. The situation is going to be worse unless prevention strategies are adopted. There is a hope to avoid such losses of lives, of health and of money by setting road safety actions. A scientific approach to the issue is essential in every country, so that road safety policies could be founded on reliable data, and meeting financial resources of each region.