Download
1 / 38
410 likes | 918 Vues
The Evolution of Strategies for the Prevention and Control of Obesity. William H. Dietz, MD, PhD Director Division of Nutrition, Physical Activity, and Obesity Centers for Disease Control and Prevention. Obesity Trends Among U.S. Adults BRFSS, 1992.

E N D
The Evolution of Strategies for the Prevention and Control of Obesity William H. Dietz, MD, PhD Director Division of Nutrition, Physical Activity, and Obesity Centers for Disease Control and Prevention
Obesity Trends Among U.S. AdultsBRFSS, 2002 (*BMI 30, or ~ 30 lbs overweight for 5’4” person) No Data <10% 10%–14% 15%–19% 20%-24% 25%
Obesity Trends Among U.S. AdultsBRFSS, 2004 No Data <10% 10%–14% 15%–19% 20%-24% 25%
Obesity Trends Among U.S. AdultsBRFSS, 2006 No Data <10% 10%–14% 15%–19% 20%–24% 25%–29% ≥30%
Obesity Trends Among U.S. AdultsBRFSS, 2007 No Data<10%10%–14%15%–19%20%–24% 25%–29% ≥30%
Obesity Trends Among U.S. AdultsBRFSS, 2008 No Data <10% 10%–14% 15%–19% 20%–24% 25%–29% ≥30%
Obesity Trends Among U.S. AdultsBRFSS, 2009 No Data <10% 10%–14% 15%–19% 20%–24% 25%–29% ≥30%
Obesity Trends Among U.S. AdultsBRFSS, 2010 No Data <10% 10%–14% 15%–19% 20%–24% 25%–29% ≥30%
Prevalence of Obesity Among U.S. Children and Adolescents 1963-70 NHES II & III 1971-74 NHANES I 1976-80 NHANES II 1988-94 NHANES III 1999-2000 NHANES
Standardized Share of Mode for Trips to School – National Personal Transportation Survey Car Bus Walk/bike Public transit McDonald NC. Am J Prev Med 2007;32:509
Shifts in Food Practices in the United States • Increased cost of healthful foods • Decreased cost of junk foods • Increased portion size • Increased variety • Increased school vending and a la carte foods 17
Changes in Dietary Habits and Weight Change Weight Change over 12-20 Years Mozaffarian D et al. NEJM 2011364:2392
Obesity Trends in Adults over the Past 12 Years Source: CDC/NCHS, NHANES; Ogden et al. 2012, NCHS data brief. Adults 20+ years; Significant increasing trend in men
Severe Obesity Trends over Past 12 Years Source: CDC/NCHS, NHANES; significant trends for both men and women
Obesity Trends in Youth over the Past 12 Years Source: CDC/NCHS, NHANES; Ogden et al. 2012, NCHS data brief. Significant increasing trend in boys
Costs of Obesity – 1998 vs 2008 19982008 Total costs $78.5 B/y $147 B/y Medical costs 6.5% 9.1% Finkelstein et al. Health Affairs 2009; 28:w822
Annual Adult per Capita Cigarette Consumption and Major Smoking and Health Events – US 1900-1998 Thousands per year 1st World Conference on smoking and health Broadcast advertising ban 1st Surgeon General’s report 1st Great American smokeout Nicotine medications Available over the counter End of WW II Fairness Doctrine messages on TV and radio Master settlement agreement 1st smoking cancer concern Surgeon General’s report on environmental Tobacco smoke Nonsmoker’s rights movement begins Federal cigarette tax doubles Great Depression 1900 1910 1920 1930 1940 1950 1960 1970 1980 1990 1998 Year
Energy Deficits Necessary to Achieve by 2020 the HP 2010 (Prevalence = 5%) or HP2020 Goals (10% Decrease) * AgeHP2010HP2020 2-5 yo 33 Kcal/d 5 Kcal/d 6-11 yo 149 Kcal/d 40 Kcal/d 12-19 yo 177 Kcal/d 31 Kcal/d Sugar drinks = 250 Kcal/d (21-50 Kcal/d consumed in schools) Healthy Weight Commitment – 1.5 trillion Kcal reduction (12.5 Kcal/capita) Quality PE = 35 Kcal/d Switch sugared for non-sugared breakfast cereal – 8-80 Kcal/d * Wang YC et al. Am J Prev Med, 2012;42:437
Principal Targets for Obesity Prevention and Control Pregnancy: pre-pregnant weight, weight gain, diabetes, smoking Reduce energy intake Decrease high and increase low ED foods Increase fruit and vegetable intake Reduce sugar drinks Decrease television time Breastfeeding Increase energy expenditure Increase daily physical activity
Social Ecological Model Federal, state and local policies to regulate and support healthy actions t Federal and State Greatest Impact lll Community Policies, standards, social networks Institutions Policy, regulations and informal structures Interpersonal Individual Family, peers, social networks Knowledge, attitudes, beliefs and behaviors Smallest Impact
National Initiatives Let’s Move Partnership for a Healthier America Child Nutrition Reauthorization – Healthy Hunger-free Kids Act Healthy Food and Sustainability Policy National Action Plan for Physical Activity Community-level Interventions (CPPW and CTGs) Surgeon General’s Call to Action on Breastfeeding Affordable Care Act Food, Farm, and Jobs Bill Transportation Reauthorization HBO’s Weight of the Nation IOM Report “Accelerating Progress in Obesity Prevention”
Institutional Progress towards Obesity Prevention and Control Food industry Healthy Weight Commitment Product reformulation Early care and education Let’s Move Child Care Schools Healthy Hunger-free Kids Act Joint use agreements Safe Routes to School
Children in Early Care and Education Programs In 2001, 73% of preschool children ages 3-5 years old (8.6 million children) participated in at least one weekly non-parental care arrangement Nearly 60% of children 3-4 years with employed mothers participate in center-based care 41% of preschool children are in child care for 35 or more hours/week Capizzano J et al. www.urban .org/url.cfm?ID=309438; www.urban .org/url.cfm?ID=309439
Let’s Move Child Care Challenge Physical activity: 1-2h/d, outside play when possible Screen time: None for <2yo; 30’/w during child care Food: Fruits or vegetables at every meal, no fried foods, family style Beverages: Water access at meals and throughout day; no sugar drinks; for > 3yo, LF or NF milk; limit juice to 4-6 oz 100% juice/d Infant feeding: Support breastfeeding for mothers who want to continue during the child care day
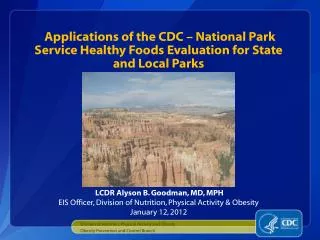
Institutional Progress towards Obesity Prevention and Control Worksites Nutrition and PA strategies in large businesses Medical settings Healthy Baby Friendly hospitals Clinical:community partnerships Communities and states – CPPW and CTG Healthy food financing initiatives Procurement policy Parks and Recreation facilities
Chronic Care Model Environment Medical System Family/Patient Self-Management Family School Worksite Community Information Systems Decision Support Delivery System Design Self Management Support Dietz WH et al. Health Affairs 2007;26:430
Community Transformation Grants Goal: Decrease death or disabilities through changes in weight, proper nutrition, physical activity, tobacco use, emotional well-being and overall mental health Priorities: Tobacco-free living Active living and healthful eating High impact quality clinical preventive services – BP, cholesterol May also address Social and emotional wellness Healthy and safe physical environment
Elements Common to Social Movements Shared and personalized perception of a threat Mobilizing frame - Narrative fidelity - Emotional engagement - moral imperative Collective identity and solidarity Network focused on collective action against a common target Communication channels - Rapid diffusion of innovation Sustained action
Opportunities • Connect existing efforts • Identify and mobilize the passionately committed • Use the HBO Weight of the Nation documentary to build grass roots support for community-based strategies • Build on the IOM report “Accelerating Progress in Obesity Prevention • Identify targets that address the triple bottom line • - Capitalize on oil dependency to promote physical transport • - Use the foreclosure crisis to restructure communities
GOALS • Make physical activity an integral and routine part of life. • Create food and beverage environments that ensure that healthy food and beverage options are the routine, easy choice. • Transform messages about physical activity and nutrition. • Expand the role of health care providers, insurers, and employers in obesity prevention. • Make schools a national focal point for obesity prevention.
Opportunities • Connect existing efforts • Identify and mobilize the passionately committed • Use the HBO Weight of the Nation documentary to build grass roots support for community-based strategies • Build on the IOM report “Accelerating Progress in Obesity Prevention • Identify targets that address the triple bottom line • - Capitalize on oil dependency to promote physical transport • - Use the foreclosure crisis to restructure communities