Download
1 / 55
560 likes | 687 Vues
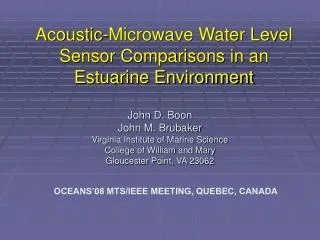
Acoustic-Microwave Water Level Sensor Comparisons in an Estuarine Environment. John D. Boon John M. Brubaker Virginia Institute of Marine Science College of William and Mary Gloucester Point, VA 23062. OCEANS’08 MTS/IEEE MEETING, QUEBEC, CANADA. Acoustic Sensor Aquatrak 3000 Series

E N D
Acoustic-Microwave Water Level Sensor Comparisons in an Estuarine Environment John D. Boon John M. Brubaker Virginia Institute of Marine Science College of William and Mary Gloucester Point, VA 23062 OCEANS’08 MTS/IEEE MEETING, QUEBEC, CANADA
Acoustic Sensor Aquatrak 3000 Series Primary Sensor NOAA/NOS National Water Level Observation Network (NWLON)
Selected Microwave Sensors 2 signal types: pulse and frequency modulated continuous wave Design Analysis Ohmart/Vega Sutron Miros Heitsenrether et al., OCEANS’08 MTS/IEEE QUEBEC
Test Setup Heitsenrether et al., OCEANS’08 MTS/IEEE QUEBEC
Microwave Sensor Design Analysis Associates (DAA) Model H-3611 Virginia Institute of Marine Science (www.vims.edu/tidewatch)
Acoustic Microwave
STORM TIDE EMERGENCYMANAGEMENT (STEM) (www.vims.edu/tidewatch) Storm Surge Tidal Water Levels Subtidal Water Levels 6-minute data in near real-time
STORM TIDE EMERGENCYMANAGEMENT (STEM) (www.vims.edu/tidewatch) Storm Surge Tidal Water Levels Subtidal Water Levels 6-minute data in near real-time Tsunami Warning Systems 1-minute data in near-real time
JAMESTOWN FERRY PIER, VA HANNA
Water Level Measurements Fixed Sampling Interval Noise (Gaussian) + Signal (periodic)
Water Level Measurements Fixed Sampling Interval Noise (Gaussian) + Signal (periodic) • Standard error = σ/√n (moving average)
Water Level Measurements Fixed Sampling Interval Noise (Gaussian) + Signal (periodic) • Standard error = σ/√n (moving average) • More is better • Interval doesn’t matter
Water Level Measurements Fixed Sampling Interval Noise (Gaussian) + Signal (periodic) • Standard error = σ/√n (moving average) • More is better • Interval doesn’t matter • Energy-Frequency distribution (numerical filter)
Water Level Measurements Fixed Sampling Interval Noise (Gaussian) + Signal (periodic) • Standard error = σ/√n (moving average) • More is better • Interval doesn’t matter • Energy-Frequency distribution (numerical filter) • Longer is better • Interval matters
Acoustic Water Level (AWL)Aquatrak 3000 NOAA/NOS • Data Collection Rate: 1 sample/sec (1Hz)
Acoustic Water Level (AWL)Aquatrak 3000 NOAA/NOS • Data Collection Rate: 1 sample/sec (1Hz) • Filtering: 181-second Moving Average
Acoustic Water Level (AWL)Aquatrak 3000 NOAA/NOS • Data Collection Rate: 1 sample/sec (1Hz) • Filtering: 181-second Moving Average • Outliers: Values>3σ eliminated
Acoustic Water Level (AWL)Aquatrak 3000 NOAA/NOS • Data Collection Rate: 1 sample/sec (1Hz) • Filtering: 181-second Moving Average • Outliers: Values>3σ eliminated • Reporting Interval: 6 minutes
Microwave Water Level (mwwl)Design Analysis Associates H-3611 • Data Collection Rate: 1 sample/minute
Microwave Water Level (mwwl)Design Analysis Associates H-3611 • Data Collection Rate: 1 sample/minute • Filtering: Finite Impulse Response (FIR)
Microwave Water Level (mwwl)Design Analysis Associates H-3611 • Data Collection Rate: 1 sample/minute • Filtering: Finite Impulse Response (FIR) • Outliers: None removed
Microwave Water Level (mwwl)Design Analysis Associates H-3611 • Data Collection Rate: 1 sample/minute • Filtering: Finite Impulse Response (FIR) • Outliers: None removed • Reporting Interval: 6 minutes
VIMS DATA BLOCK: 12 one-minute water levels 11 minute series
VIMS DATA BLOCK: 12 one-minute water levels 11-point Moving Average ?
VIMS DATA BLOCK: 12 one-minute water levels 11-point Moving Average ? Finite Impulse Response (FIR) Filter with weights
VIMS DATA BLOCK: 12 one-minute water levels 11-point Moving Average Finite Impulse Response (FIR) Filter with weights Symmetric filter
VIMS DATA BLOCK: 12 one-minute water levels FIR Frequency Response Function* *Fitted using Bloomfield’s least squares approximation
27 minute pass 6 minute stop
88 minute pass 21 minute stop
Findings • Microwave, acoustic sensors in agreement
Findings • Microwave, acoustic sensors in agreement • No indication of wave-induced “offset”