Analysis of DNA Microarray Data: Sensitivity, Specificity, and Other Real-World Issues
1.43k likes | 1.61k Vues
Analysis of DNA Microarray Data: Sensitivity, Specificity, and Other Real-World Issues. 1. Definitions and basic considerations. DNA microarrays. Major advantage Simultaneous measurement of level of expression for nearly all transcribed genes within given cell or tissue Major disadvantage

Analysis of DNA Microarray Data: Sensitivity, Specificity, and Other Real-World Issues
E N D
Presentation Transcript
Analysis of DNA Microarray Data: Sensitivity, Specificity, and Other Real-World Issues
DNA microarrays • Major advantage • Simultaneous measurement of level of expression for nearly all transcribed genes within given cell or tissue • Major disadvantage • Cost
Therefore, to get the most bang for the buck, it is imperative to understand the role of uncertainty in measurement…
Categorical tests (yes/no, based upon threshold) • Gene arrays • Is gene expressed or not? • Is gene differentially expressed under two different experimental conditions? • Medical tests • Does patient have disease or not?
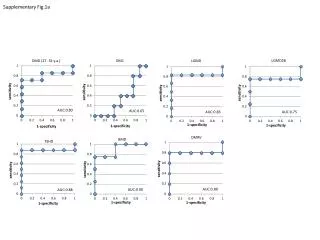
Key concepts for categorical tests • Specificity • true negative rate • 1 – FPR (false positive rate) • Sensitivity • TPR (true positive rate)
Specificity provides the answer to questions like… • What fraction of patients who are disease-free are correctly classified as disease-free? • What fraction of genes that are not differentially expressed are correctly classified as being non-differentially expressed?
Specificity • Specificity is defined as true negative rate • Probability that disease-free patient will be correctly categorized as disease-free • False positive rate (FPR) = 1 – specificity • Probability that disease-free patient will be incorrectly categorized as having disease
Sensitivity and specificity deal with distinct sets of patients or genes • Specificity • Healthy patients lacking the disease • Non-expressed genes • Non-differentially expressed genes • Sensitivity • Sick patients having the disease • Expressed genes • Differentially expressed genes
Sensitivity provides the answer to questions like… • What fraction of patients who have a given disease are correctly classified as diseased? • What fraction of genes that are differentially expressed are correctly classified as being differentially expressed?
Sensitivity • Sensitivity is defined as true positive rate • Probability that diseased patient will be correctly categorized as having the disease
Yin and yang of sensitivity and specificity • Improving specificity always worsens sensitivity • Improving sensitivity always worsens specificity
SMEASURE = measured signal STRUE = true signal N = noise (error)
Noise-to-Signal (N:S) Ratio • N : S << 1 • reliable and trustworthy measurement • N ~ S • unreliable measurement • N > S • highly unreliable measurement
Sources of uncertainty in categorical measurements • Measurement uncertainty • SMEASURE does not necessarily equal STRUE • N ~ S or N > S • “Overlap” uncertainty • Some patients with disease truly have positive test values • Some patients without disease truly have negative test values
Gene arrays and medical tests have distinct and different sources of uncertainty
Variability in medical tests is mostly “overlap” • Measurement variability • Essentially none (error is of no clinical significance) • N : S << 1 • Hence, perform test once and only once • “Overlap” variability • Ubiquitous and essentially unavoidable • Feature of all medical tests to one degree or another • So what’s the solution? • Search for a better test
Variability in DNA microarrays is mostly measurement uncertainty • Measurement variability • Ever-present • N > S for many genes • “Overlap” variability • None • Absent gene has expression level of zero, whereas present gene has expression level of non-zero • Differentially expressed gene… • So what’s the solution? • Repeated measurements
Take mean of repeated measurements...
Benefits of repeated measurements • Assuming that noise N has a normal (Gaussian) distribution, then the error decreases with square root of number n of measurements • Example: to reduce N : S by half, take mean of 4 measurements
Signal Log Ratio (SLR) • SLR = logarithm to base 2 of the ratio of the signal for gene under experimental condition A (SA1) to that for the same gene under experimental condition N (SN1)
Examples of SLR SA1 = 4000 SA1 = 2 SN1 = 1000 SN1 = 16 SLR = log2 (4) = 2 SLR =log2 (1/8) = –3
To get a handle on specificity, perform same-versus-same comparisons • SLRTRUE must be zero • log2 (1) = 0 • Hence, SLRMEASURE is all noise
Perform separate analyses for “present” and “absent” genes • Present genes • N : S << 1 • Absent genes • N : S ≥ 1
Experimental system • Primary cultures of peritoneal macrophages from mice of 3 strains • BALB/c (normal) • MRL/+ (autoimmune lupus) • MRL/lpr (autoimmune lupus) • Each array represents mRNA pooled from distinct sets of ~ 6 mice harvested on separate days • Macrophages were stimulated with bacterial endotoxin (lipopolysaccharide, LPS) for 8 or 24 hours
Present genes: Same-vs.-same comparison (single array) • Average SLR = ~ 0.02 + 0.04 (~ 1.014-fold) • not different from zero • that’s good! • Standard deviation = ~ 0.69 + 0.30 • ~ 32% genes have SLR > 0.69 (1.61-fold induction) • ~ 4% genes have SLR > 1.38 (2.60-fold induction) • that’s not good
Present genes: Statistical distribution of SLR • Entire distribution • Not normal (p < 0.01, by D statistic) • Central 95% • Normal (p > 0.2, by D statistic) • Highly noteworthy, since D statistic detects tiny tiny deviations from normality • 5% at tails overestimate the SLR
If we compare genes in central 95% versus genes in 5% tails… • Center (95% genes) • Mean signal intensity = 1493 • Tails (5% genes) • Mean signal intensity = 620 (p < 10-19, t-test) • Consistent with intuitive idea that measurement variability is inversely related to level of gene’s expression
Absent genes: Same-vs.-same comparison (single array) • Average SLR = ~ 0.33 + 0.31 (~ 1.26-fold induction) • definitely not good • Standard deviation = ~ 1.12 + 0.24 • > 35% genes have SLR > 1.0 (2-fold induction) • > 5% genes have SLR > 2.0 (4-fold induction) • even worse!
Absent genes: Statistical distribution of SLR • Entire distribution • Not normal (p < 0.01, by D statistic) • Central 95% • Not normal (p < 0.01, by D statistic) • Central 60% • Not normal (p < 0.01, by D statistic)
Summary of same-vs.-same comparisons (single array) • Use SLR only for genes that are actually expressed (i.e., “present” genes) • Central 95% normally distributed with standard deviation of ~ 0.69 • 2.5% at each tail exceeds normal distribution • Do not use SLR for genes that are marginally, if at all, expressed (i.e., “absent” genes) • Most of measured signal is noise • SLR is therefore ratio of two small randomly distributed values