### Evaluating Classification Models with ROC Curve Analysis in Medical and Financial Applications ###
80 likes | 179 Vues
The ROC Curve procedure is a powerful tool for assessing the performance of binary classification systems. It evaluates sensitivity (true positive rate) and specificity (true negative rate) to determine the effectiveness of various diagnostic models. This document illustrates the application of ROC curves through three hypothetical scenarios: detecting HIV infection using a rapid assay, predicting fever in patients based on biochemical predictors, and assessing the risk of loan defaults in banking. By comparing different models, the ROC Curve helps identify the most effective predictive techniques. ###

### Evaluating Classification Models with ROC Curve Analysis in Medical and Financial Applications ###
E N D
Presentation Transcript
Diagnosis Roc Curve
ROC Curve The ROC Curve procedure provides a useful way to evaluate the performance of classification schemes that categorize cases into one of two groups
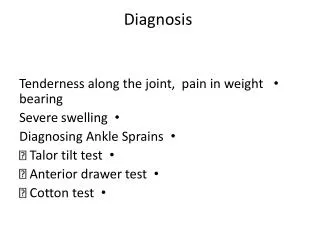
Sensitivity and Specificity Sensitivity = P(+|D) ; Specificity = P(-|H) Normal Disease - + Cut off Point
ROC : Example 1 This is a hypothetical data file that concerns the efforts of a pharmaceutical lab to develop a rapid assay for detecting HIV infection. The results of the 3 assays are 10 deepening shades of red, with deeper shades indicating greater likelihood of infection. A laboratory trial was conducted on 200 blood samples, half of which were infected with HIV, and half of which were clean. (SPSS11)
ROC : Example 2 Fever: A physician is interested in predicting whether or not patients will have the symptom of fever. You have proposed a model that is based on a subset of the two available biochemical predictors, Use ROC Curve to compare the predictive abilities of these two models. (NCSS)
ROC : Example 3 Bank-loan : A bank is interested in predicting whether or not customers will default on loans. You have proposed a model that is based on a subset of the available predictors, and you now need to show that its results are better than those from a simpler model currently in use and no worse than results from a more complex model. Use ROC Curve to compare the predictive abilities of these three models.(SPSS11)