Download
1 / 26
280 likes | 440 Vues
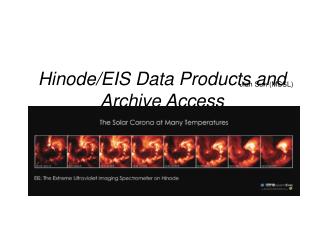
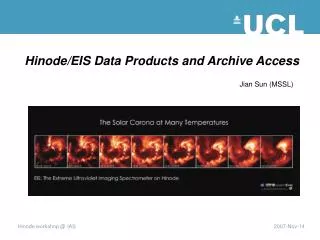
Introduction to the EIS instrument on Hinode. Dr Peter Young Rutherford Appleton Laboratory, UK. Basic facts. EIS – EUV Imaging Spectrometer Successor to CDS on SOHO Covers two wavelength bands: 170-211 Å, 246-292 Å Principally for coronal spectroscopy

E N D
Introduction to the EIS instrument on Hinode Dr Peter Young Rutherford Appleton Laboratory, UK Dr Peter Young, Rutherford Appleton Laboratory
Basic facts • EIS – EUV Imaging Spectrometer • Successor to CDS on SOHO • Covers two wavelength bands: 170-211 Å, 246-292 Å • Principally for coronal spectroscopy • PI institutes: MSSL (UK), NRL (USA), NAOJ (Japan) • PI: Prof Louise Harra (MSSL) Dr Peter Young, Rutherford Appleton Laboratory
Instrument layout Multilayer coating – gives high reflectivity in EUV Aluminium filters – block out visible light Single mirror for focussing – improves throughput of telescope Back-thinned CCDs – directly sensitive to EUV radiation Dr Peter Young, Rutherford Appleton Laboratory
Field of view N A coarse offset can also be applied to offset EIS from the other instruments EIS (576”x512”) E W SOT:NFI/SP (328”x164”) SOT:BFI (205”x102”) XRT (2048”x2048”) Dr Peter Young, Rutherford Appleton Laboratory
CCD image 2048 pixels 1024 pixels CCD-A Long wavelength 246-292 Å CCD-B Short wavelength 170-211 Å Dr Peter Young, Rutherford Appleton Laboratory
Slit options • Four slits available, defined by their width • 1” and 2” slits are for spectroscopy • 40” and 266” slits for imaging 1” 266” Dr Peter Young, Rutherford Appleton Laboratory
Using wide slits: context images Context slot raster, Fe XII 195 Duration: 3min 20s 2” slit raster, Fe XII 195 Duration: 22min Dr Peter Young, Rutherford Appleton Laboratory
Using wide slits: movies • The most ‘clean’ emission line for the 266” slit is Fe XV 284.16 (2 million K) EIS wide slot movie Fe XV 284.2 (logT=6.3) Courtesy H. Warren (NRL) Dr Peter Young, Rutherford Appleton Laboratory
The EIS spectrum • Spectrum dominated by coronal ions (iron, particularly) • Few useful transition region lines, but not strong Young et al. (2007, PASJ, in press) Dr Peter Young, Rutherford Appleton Laboratory
Telemetry limitations • The EIS data rate is limited to around 50 kbits/s • Data are routinely compressed using DPCM (lossless) by a factor of around 3 • JPEG (lossy) compression is also allowed • Despite this, complete CCD data can not be obtained routinely • Specific wavelengths (emission lines) must be chosen • reduced spatial coverage along slit (solar-Y) Dr Peter Young, Rutherford Appleton Laboratory
Science capability • Transition region lines • Coronal iron lines • Flare lines • Density diagnostics • Line width and velocity maps Dr Peter Young, Rutherford Appleton Laboratory
Transition region lines • EIS spectra are dominated by coronal iron lines, but there are a number of useful transition region lines Density in loop footpoints Young et al. (2007, PASJ) Dr Peter Young, Rutherford Appleton Laboratory
Coronal iron lines Dr Peter Young, Rutherford Appleton Laboratory
Flaring loop (17 Dec) Dr Peter Young, Rutherford Appleton Laboratory
Spectroscopy • Emission line diagnostics come in two types • Study of shape and position of emission lines • yields plasma velocity, broadening parameters • Study of emission line strengths • yields temperatures, densities, abundances, emission measure • requires detailed atomic data Dr Peter Young, Rutherford Appleton Laboratory
Doppler shifts • Each emission line has a standard position (the rest wavelength) • Shifts from this position imply motion of the plasma • blueshifts: towards the observer • redshifts: away from the observer Blueshift Redshift Dr Peter Young, Rutherford Appleton Laboratory
Line width diagnostics • The width of emission lines can be written in velocity units as • The components of Δv are written as • where • ΔvI is the instrumental width • 2kT/M is the thermal width • ξ is the non-thermal velocity Dr Peter Young, Rutherford Appleton Laboratory
Line width and velocity maps • Active region map • Fe XII 195.12 Å • 2006 Dec 2 Intensity Velocity Width Dr Peter Young, Rutherford Appleton Laboratory
Close-up of loop: line width Dr Peter Young, Rutherford Appleton Laboratory
Close-up of loop: velocity Dr Peter Young, Rutherford Appleton Laboratory
Caution: non-Gaussian profiles • Line profiles are not always Gaussian Dr Peter Young, Rutherford Appleton Laboratory
Density diagnostics • Certain emission lines from particular ions have ratios that are sensitive to the plasma density • EIS is the first solar UV instrument to routinely allow high precision density measurements • high effective area • access to best coronal density diagnostics Dr Peter Young, Rutherford Appleton Laboratory
Density map from SOHO/CDS (Tripathi et al. 2006) Density maps • The high quality of the EIS data make density maps easy to generate • Big improvement over SOHO/CDS density maps Dr Peter Young, Rutherford Appleton Laboratory
Best density diagnostics Dr Peter Young, Rutherford Appleton Laboratory
Instrumental effects to be wary of • There is a spatial offset in both X and Y between the two EIS CCDs • X: 2 pixels, Y: 15-20 pixels • The line centroids vary by around 60-70 km s-1 through an orbit • Line centroids and widths vary along the EIS slit • The EIS slits are slightly tilted relative to CCD • There are a number of warm and hot pixels on the detector • There are a few dust particles on the CCDs • affects Fe XI 188.23 and Fe XII 193.51 • Image wobble (satellite & instrument) leads to strange effect in raster movies Dr Peter Young, Rutherford Appleton Laboratory
EIS observations • Basic observation units for EIS are called studies • Different studies have unique acronyms; there are over 220 • e.g., COMSCI_AR3, PRY_footpoints_v2, SYNOP001 • Studies actually comprise one or more rasters • A raster can be, e.g., • a scan of a region with the narrow slit • sit-and-stare with narrow slit or wide slit Dr Peter Young, Rutherford Appleton Laboratory