Download
1 / 25
250 likes | 262 Vues
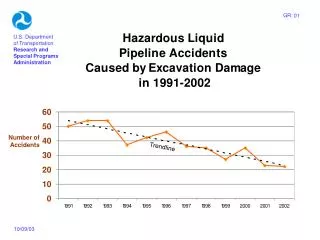
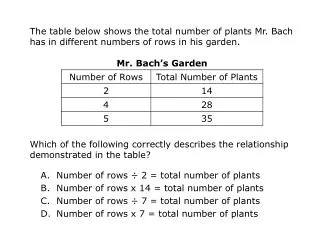
This application focuses on the collection, processing, and interpretation of numerical data using charts and graphs. It covers various aspects such as amounts or sizes, scales or proportions, and handling statistics. Candidates will plan and carry out activities that involve multi-stage calculations and present their findings in different ways.

E N D
Application of Number INSET June 2007
Application of Number What is Application of Number?
2004 Standards • Collect > Process > Interpret • Graph is a Chart is a Graph • Amounts OR Sizes • Scales OR Proportions • With or without a calculator • Parts A and Parts B
Clarification • Level 1 All assessment criteria to be covered in one or more activities (ideally in context with standalone work limited)
Clarification • Level 2 At least one activity covering N2.1 collect, N2.2 process and N2.3 present. If all of N2.2 not covered then second activity covering N2.1 + N2.2 or N2.2 + N2.3 if required. Must involve process plus one other stage
Clarification • Level 3 All assessment criteria to be covered through one or more activities that each covers N3.1, N3.2 and N3.3 Collect + Process + Present
Introduction Level 1 Statement of purpose Level 2 As above + description of selected activity Level 3 Candidates must plan their activities and identify and carry out tasks for themselves, including alternative approaches.
Level 1 – Sources • N1.1 (Straight forward) 10 Two different sources, at least one to include a table, graph, chart or diagram N1.1.1 Obtain information N1.1.2 Identify suitable calculations
Level 1 – Carry out and Check • N1.2.1 Carryout calculations to given levels of accuracy • N1.2.2 Check the results make sense
Level 1 – Carry out & Check • N1.2 a. Amounts or sizes Whole numbers and simple decimals Simple percentages and fractions Areas and volumes of rectangular shapes • N 1.2 b. Scales or proportions Use scales on diagrams Use ratio and proportion (3:1) • N 1.2 c. Handling statistics Mean and range, such as 10 items
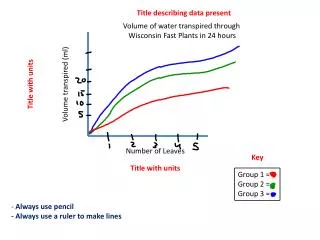
Level 1 – Interpret & Present • N1.3 - Present results in two different ways using charts or diagrams N1.3.1 Choose suitable ways N1.3.2 Use more than one way N1.3.3 Use a chart or diagram N1.3.4 Describe what the results tell you
Level 2 • Statement of purpose + description of selected activity • Not standalone activities at level 2
Level 2 – Sources • N2.1 (Relevant) 20 Two different sources, one MUST include a graph or chart. (not a table, diagram or map) N2.1.1 Choose how to get the information N2.1.2 Obtain the information N2.1.3 Choose appropriate methods
Level 2 – Carry out & Check • N2.2.1 Clearly show methods and levels of accuracy • N2.2.2 Check methods, correct errors and make sure results make sense
Level 2 – Carry out & Check • N2.2 a. Amounts or sizes Calculations involving two + steps, numbers of any size Convert between %, decimals and fractions and between systems of measurement Areas and volumes of composite (L-shaped) shapes • N2.2 b. Scales or proportions Work out dimensions from more complex scale drawings using more complex scales Calculate using ratios (3:5) Stratified sampling
Level 2 – Carry out & Check • N2.2 c. Handling statistics COMPARE 2 sets of data, of appropriate size, such as 20 items using %, mean, mode, median and range • N2.2 d. Using formulae Understand and use given formulae (words and symbols), e.g. compound interest, area of circle.
Level 2 - Interpret & Present • N2.3 - Overall, present findings in two different ways using charts, graphs or diagrams N2.3.1 Select effective ways N2.3.3 Use more than one way N2.3.2 Use a chart, graph or diagram and describe your methods N2.3.4 Describe what the results tell you and how they meet the purpose
Process N *.2, Checks • N 1.2.2, Check the results make sense • N 2.2.2, Check methods and make sure the results make sense • N 3.2.2, Check methods and results to help ensure that errors are found and corrected Estimation, spreadsheets, scale drawing, order of magnitude and reverse calculations. Others??? Encourage estimation.
Level 3 • All assessment criteria to be covered through one or more activities that each cover N3.1, N3.2 and N3.3 • Candidates must plan ALL their activities and identify and carry out tasks for themselves and consider alternative approaches
Level 3 – Plan & Relevancy • N3.1 Two different sources, including a large data set (over 50 items) N3.1.1 Plan how to get and use the information N3.1.2 Obtain the information N3.1.3 Choose appropriate methods and justify the choice.
Level 3 - Multi-stage Calculations • N3.2.1 To appropriate levels of accuracy, clearly showing methods. • N3.2.2 Check methods and results to help ensure that errors are found and corrected all results need to be checked for sense.
MULTI-STAGE CALCULATIONS What is a multi-stage calculation? • The result from one calculation is used for subsequent calculations. • e.g. Calculating the mean and substitute into the formula for standard deviation
Level 3 - Multi-stage Calculations • N3.2 a. Amounts or sizes Multi stage calculations. Use of powers and roots Finding missing angles and sides • N 3.2 b. Scales or proportions Work out dimensions from complex scale drawings Calculate proportional change (x 1.175) Proportional pie charts Stratified Sampling
Level 3 - Multi-stage Calculations • N 3.2 c. Handling statistics Compare distributions using grouped data, data set of 50 items, using several methods, histograms, cumulative frequency charts and calculation of estimation of mean, s.d., etc. • N 3.2 d. Using formulae Use formulae, equations and expressions (demonstrate progression)
Level 3 - Interpret & Present • N3.3 – Overall, present findings in two different ways using charts, graphs or diagrams N3.3.1 Select appropriate methods of presentation and justify the choice N3.3.2 Present findings effectively N3.3.3 Describe what the results tell you and whether they meet the purpose