Download
1 / 17
170 likes | 298 Vues
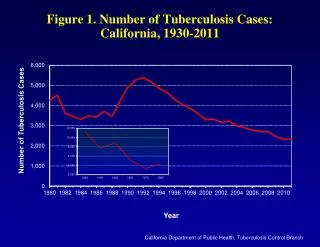
Figure 1. Number of Tuberculosis Cases: California, 1930-2011. Number of Tuberculosis Cases. Year. California Department of Public Health, Tuberculosis Control Branch. Figure 2. Number of Tuberculosis Cases and Case Rates: California, 2002-2011. Case Rate per 100,000. Number of Cases. *.

E N D
Figure 1. Number of Tuberculosis Cases: California, 1930-2011 Number of Tuberculosis Cases Year CaliforniaDepartment of Public Health, Tuberculosis Control Branch
Figure 2. Number of Tuberculosis Cases and Case Rates: California, 2002-2011 Case Rate per 100,000 Number of Cases * Number of Cases Case Rate per 100,000 Population National Case Rate * California Department of Public Health, Tuberculosis Control Branch
Figure 3. Tuberculosis Cases by Race/Ethnicity: California, 2011 American Indian/ Alaska Native 5 (0.2%) Black 137 (5.9%) Unknown 1 (<0.1%) White 197 (8.5%) 76 Asian/Pacific Islander 1,137 (48.9%) Hispanic 848 (36.5%) California Department of Public Health, Tuberculosis Control Branch
Figure 4. Tuberculosis Case Rates by Race/Ethnicity: California, 2002-2011 Cases per 100,000 California Department of Public Health, Tuberculosis Control Branch
Figure 5. Tuberculosis Cases in Foreign-born andU.S.-born Persons: California, 2002-2011 Percent of Cases Number of Cases 78 California Department of Public Health, Tuberculosis Control Branch
Figure 6. Tuberculosis Cases by Country of Origin: California, 2011 Unknown 27 (1.2%) Foreign-born 1,787 (76.9%) U.S.-born 511 (21.9%) Mexico 497 (27.8%) All Other Countries 675 (37.8%) Vietnam 240 (13.4%) Philippines 375 (21.0%) California Department of Public Health, Tuberculosis Control Branch
Numberof Cases Percent of Cases Figure 7. Tuberculosis Cases in Persons0-4 Years of Age: California, 2002-2011 Number of Cases Percent of Cases 2002 2003 2004 2005 2006 2007 2008 2009 2010 2011 Year California Department of Public Health, Tuberculosis Control Branch
Figure 8. Tuberculosis Cases by Verification Criteria: California, 2011 Positive Smear 12 (0.5%) Provider Diagnosis 98 (4.2%) NAAT* 39 (1.7%) Clinical Case 336 (14.5%) 81 Positive Culture 1,840 (79.1%) *NAAT= Nucleic Acid Amplification Test California Department of Public Health, Tuberculosis Control Branch
Died During Treatment Died Before Starting Treatment Dead at Diagnosis Percent Dying with Tuberculosis Figure 9. Deaths in Persons with Tuberculosis: California, 2000-2009 Percent of Cases Number of Deaths California Department of Public Health, Tuberculosis Control Branch
Figure 10. Tuberculosis Cases by HIV/AIDS Diagnosis:* California, 2001-2010 Number of Tuberculosis Cases with HIV/AIDS Percent of Tuberculosis Cases with HIV/AIDS Percent of Cases with HIV/AIDS Number of Cases with HIV/AIDS 83 * Match found in HIV/AIDS Registry, California Department of Public Health, Office of AIDS California Department of Public Health, Tuberculosis Control Branch
Figure 11. HIV/AIDS-associated Tuberculosis* by Race/Ethnicity: California, 2001-2010 Number of Cases with HIV/AIDS * Match found in HIV/AIDS Registry, California Department of Public Health, Office of AIDS California Department of Public Health, Tuberculosis Control Branch
Figure 12. Tuberculosis Cases with Multidrug Resistance (MDR) on Initial or Final Drug Susceptibility Testing:* California, 2000-2009 Initial Susceptibility Test Final Susceptibility Test 43 41 38 37 36 35 34 33 32 28 Number of MDR Tuberculosis Cases 2000 2001 2002 2003 2004 2005 2006 2007 2008 2009 *Cases with resistance to at least isoniazid, and either rifampin, rifabutin or rifapentine reported on the Initial Drug Susceptibility Report (Follow-up 1) or on the Case Completion Report (Follow-up 2) California Department of Public Health, Tuberculosis Control Branch
Figure 13. Tuberculosis Cases with Initial Multidrug Resistance (MDR):* California, 2007-2011 Initial MDR Cases: 2007-2011 ³25 cases 15-24 cases 5-14 cases 1-4 cases None Berkeley San Francisco Pasadena Long Beach *Cases with initial drug resistance to at least isoniazid, and either rifampin, rifabutin or rifapentine California Department of Public Health, Tuberculosis Control Branch
Figure 14. Tuberculosis Cases1 by Outcome of Therapy: California, 2009 No Information 28 (1.2%) Lost3 21 (0.9%) Refused 17 (0.7%) Died 180 (7.5%) Other 31 (1.3%) Moved2 97 (4.1%) Completed Therapy >12 Months 235 (9.8%) Completed Therapy £12 Months 1,780 (74.5%) 1 Patient was alive at diagnosis and started on an initial drug regimen of two or more drugs. 2 Patient moved to another jurisdiction with a known forwarding address before treatment was completed; final outcome not available. 3 Patient could not be located prior to the completion of treatment. California Department of Public Health, Tuberculosis Control Branch
Figure 15. Outcome in Tuberculosis Cases for Whom One Year or Less of Treatment was Indicated1: California, 2009 No Information 25 (1.1%) Refused 16 (0.7%) Other 29 (1.2%) Lost3 21 (0.9%) Died 175 (7.5%) Moved2 91 (3.9%) Completed Therapy >12 Months 195 (8.4%) Completed Therapy £12 Months 1,770 (76.2%) 1 Excludes cases with rifampin resistant disease, cases with meningeal disease, and cases less than 15 years of age with disseminated tuberculosis disease. 2 Patient moved to another jurisdiction with a known forwarding address before treatment was completed; final outcome not available. 3 Patient could not be located prior to the completion of treatment. California Department of Public Health, Tuberculosis Control Branch
Figure 16. Outcome in Tuberculosis Cases for Whom Greater than One Year of Treatment was Indicated:1 California, 2009 Refused 1 (2.0%) Other 2 (3.0%) No Information 3 (4.5%) Completed Therapy £12 Months 10 (14.9%) Died 5 (7.5%) Moved2 6 (9.0%) Completed Therapy >12 Months 40 (60.0%) 1 Includes cases with rifampin resistant disease, cases with meningeal disease, and cases less than 15 years of age with disseminated tuberculosis disease. 2Patient moved to another jurisdiction with a known forwarding address before treatment was completed; final outcome not available. California Department of Public Health, Tuberculosis Control Branch
Completed in 1 year or less Completed Figure 17. Completion of Tuberculosis Therapy: California, 2000-2009 90 Note: Excludes cases with rifampin resistant disease, cases with meningeal disease, cases less than 15 years of age with disseminated tuberculosis disease, and those that died during treatment. California Department of Public Health, Tuberculosis Control Branch