Download
1 / 19
190 likes | 483 Vues
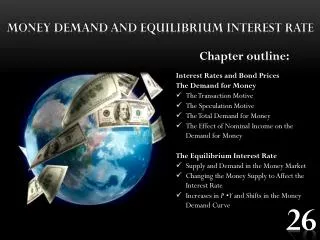
Money Demand and the Equilibrium Interest Rate. CHAPTER OUTLINE. The Demand for Money The Equilibrium Interest Rate. Adapted from:. Fernando & Yvonn Quijano. 11.1 The Demand for Money. For simplicity, let us assume that there are only 2 kinds of assets available to households:

E N D
Money Demand andthe EquilibriumInterest Rate CHAPTER OUTLINE The Demand for Money The Equilibrium Interest Rate Adapted from: Fernando & Yvonn Quijano
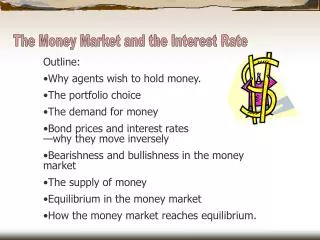
11.1 The Demand for Money • For simplicity, let us assume that there are only 2 kinds of assets available to households: • Money: Currency in circulation and deposits in checking accounts that do not pay interest. • Versus • Bonds: Assume to cover interest-bearing securities of all kinds. • When we speak of the demand for money, we are concerned with how much of your financial assets you want to hold in the form of money, versus how much you want to hold in bonds.
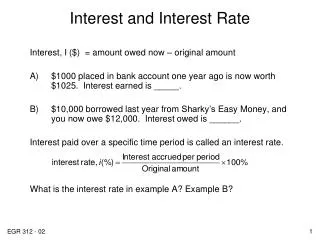
11.1 The Demand for Money (1) The Transaction Motive • You decision to hold money involves a trade-off between: • High liquidity of money to meet your transaction needs (transaction motive); • Interest income offered by bonds. • The opportunity cost of holding money is the interest rate foregone on bonds. For instance, if you can earn 8% a year on bond, then holding an additional $100 in money costs you $8 a year. • Illustration: • Suppose that Jim earns $1200 per month. How could he manage his income optimally?
Jim could decide to deposit his entire paycheck ($1,200) into his checking account at the start of the month and run his balance down to zero by the end of the month. In this case, his average balance would be $600 [(starting balance + ending balance) / 2]. But he is giving up interest income from investing in bonds!
Jim could also choose to put half of his paycheck into his checking account and buy a bond with the other half of his income. At midmonth, Jim would sell the bond and deposit the $600 into his checking account to pay the second half of the month’s bills. Following this strategy, Jim’s average money holdings would be $300. Jim can continue to lower his average money holdings, but the switching from bonds to money incurs costs such as brokerage fees.
Number of switches: 0 = Jim puts all the $1200 into his checking account. 1 = Jim buys one bond, indicating he puts $600 into his checking account, and uses the remaining $600 to buy bond. 2 = Jim buys two bonds, indicating that he puts $400 into his checking account, and buys two $400 bonds. 3 = Jim buys three bonds, indicating that he puts $300 into his checking account, and buys 3 $300 bonds. 4 = Jim buys four bonds, indicating that he puts $240 into his checking account, and buys 4 $240 bonds. Average Money Holdings (AMH): AMH = (starting balance + ending balance) / 2 When switches = 0, AMH = (1200 + 0) / 2 = $600 When switches = 1, AMH = (600 + 0) / 2 = $300 When switches = 2, AMH = (400 + 0) / 2 = $200 When switches = 3, AMH = (300 + 0) / 2 = $150 When switches = 4, AMH = (240 + 0) / 2 = $120
Average Bond Holdings (ABH): ABH = (starting balance + ending balance) / 2 When switches = 0, ABH = (0 + 0) / 2 = $0 When switches = 1, ABH = (600 + 0) / 2 = $300 When switches = 2, ABH = (800 + 0) / 2 = $400 When switches = 3, ABH = (900 + 0) / 2 = $450 When switches = 4, ABH = (960 + 0) / 2 = $480 Summary: When r = 5%, optimal money holdings = $150 When r = 3%, optimal money holdings = $200 The lower the rate, the more money on average is held. The higher the rate, the higher the opportunity cost (more interest foregone) from holding money, the less money on average is held. The demand for money depends negatively on interest rate (i.e. the money demand curve is downward-sloping).
(2) The Speculation Motive To explain the speculative motive, we need to understand the relation between bond prices and interest rates Illustration: On Jan 2, 2008, Company XYZ issued a 15-year bond that had a face value of $1000, and paid a couple of $100 per year. Suppose that the market-determined price was $900. Interest rate = (100/900)*100 = 11.1% p.a. Suppose that the holder of the XYZ bond (Jim) wanted to sell after a year, what price could he get? It all depends on the prevailing interest rate. Let say the interest rate on Jan 2, 2009 was 20%, do you think he will be able to sell for more or less than $900?
On Jan 2, 2009, another company ABC issued a 15-year bond that had a face value of $1000. The market-determined price was $900. At the prevailing interest rate of 20%, the couple payment was $180 p.a. • As a rational investor, would you buy from: • Jim at $900, with a coupon payment of $100 per year • company ABC at $900, with a coupon payment of $180 per year • Of course, a rational person would buy from company ABC! • So, in order to dispose of his bond holding, Jim has to lower his selling price (say to $500). • When interest rate from 11.1% to 20%, the prices of existing bonds fall • (from $900 to $500). • This implies a inverse relation between bond prices and interest rates.
(2) The Speculation Motive When interest rates are high When interest rates are higher than normal, investors expect them to fall in the future (and prices of existing bonds will rise). There is a speculative motive for holding more bonds now (and hence less money), with the hope of selling them in future when bond prices rise (i.e. when interest rates fall). When interest rates are low When interest rates are lower than normal, investors expect them to rise in the future (and prices of existing bonds will fall). There is a speculative motive for holding more money now (and hence less bonds), with the hope of buying bonds in future when the prices fall (i.e. when interest rates rise). The demand for money depends negatively on interest rate (i.e. the money demand curve is downward-sloping).
Money Demand Curve The quantity of money demanded is a negative function of the interest rate. A change in r brings a change in money demanded and a movement along the Md curve.
11.2 Other Determinants of Money Demand • The demand of money depends on the total dollar volume of transactions in the economy. • Two components of total dollar volume of transactions are: • How many transactions? • How much is the average transaction amount? • How many transactions? • A reasonable indicator for the number of transactions is aggregate output (income), Y. • When Y , there are more transactions in the economy, and Md shifts to the right.
How much is the average transaction amount? The average dollar amount of each transaction depends on the prices, P. If P twice, the dollar amount of each transaction also double (twice as much money is needed to conduct the same real transaction), and Md shifts to the right. Md = P x L(Y, r) Money demand is proportional to the price level. If P doubles, Md will also double For any given P, money demand depends (through the function L) on Y and r. When Y , Md When r , Md
11.3 The Equilibrium Interest Rate We are now in a position to consider one of the key questions in macroeconomics: How is the interest rate determined in the economy? The point at which the quantity of money demanded equals the quantity of money supplied determines the equilibrium interest rate in the economy.
Supply and Demand in the Money Market • Equilibrium exists in the money market when the supply of money is equal to the demand for money (or equivalently, the supply of bonds is equal to the demand for bonds). • At r0, Ms > Md • There is an excess demand for • bonds. • Investors would bid up the • price of bonds, bringing interest • rate down to r*. • At r1, Ms < Md • There is an excess supply of • bonds. • Investors would bid down the • price of bonds, bringing interest • rate up to r*.
Changing the Money Supply to Affect the Interest Rate • The Fed can expand money supply by: • reduce the required reserve ratio • lower the discount rate • buy government securities in the open market • An increase in the supply of money lowers the rate of interest from 14 percent to 7 percent.
Increases in Y or P and Shifts in the Money Demand Curve An increase in aggregate income (Y) or price level (P) shifts the money demand curve to the right. As a result, the equilibrium interest rate rises from 7 percent to 14 percent.