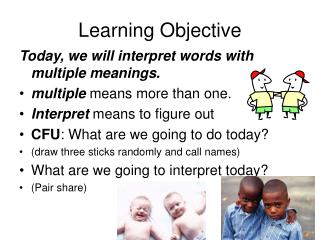
Learning Objective Question Instructions
Learning Objective Question Instructions. What am I doing? You have been assigned a learning objective. Copy and paste your learning objective into the designated slide. You are creating 4 questions based on your assigned learning objective.


Learning Objective Question Instructions
E N D
Presentation Transcript
Learning Objective Question Instructions • What am I doing? • You have been assigned a learning objective. Copy and paste your learning objective into the designated slide. • You are creating 4 questions based on your assigned learning objective. • Your questions should be modeled after the AP Exam. You may use questions from online, or your AP Review Book, as long as it is not a question we have used in class before. • For each question you will need a question slide, followed by an answer slide. • At the top of your question slide, write which learning objective you are addressing, and which question number (Learning Objective 1.1; Question 1). An example has been done for you. • At the top of your answer slide, write which learning objective you are addressing, and which question you are answering (Learning Objective 1.1; Answer 1). An example has been done for you. • Your Answer slide needs to be well reasoned. For a multiple choice question, it is not enough to write the correct answer, you need to explain why the answer is correct. • Use the default font and style. Do not try to make it look fancy
Learning Objective 1.1 • The student is able to convert a data set from a table of numbers that reflect a change in the genetic makeup of a population over time and to apply mathematical methods and conceptual understandings to investigate the cause(s) and effect(s) of this change
Learning Objective 1.1 Question 1 Table 1.1, Phenotypic Frequency over 60 years For a population of small forest trolls, the red allele is dominant to the purple allele. The habitat has no selection preference for either color. • Assume during the time period represented in the graph, the small troll habitat was disrupted by a natural disaster. Describe an event that could account for the data in table 1.1. Explain how this event could account for the data in the table. Support your explanation using quantitative reasoning.
Learning Objective 1.1 Question 1 Answer Table 1.1, Phenotypic Frequency over 60 years For a population of small forest trolls, the red allele is dominant to the purple allele. The habitat has no selection preference for either color. • Assume during the time period represented in the graph, the small troll habitat was disrupted by a natural disaster. Describe an event that could account for the data in table 1.1. Explain how this event could account for the data in the table. Support your explanation using quantitative reasoning. • The natural disaster (fire, volcano, tsunami…) likely occurred between 1910 and 1925. This event likely wiped out a large quantity of the population and thus, the gene pool. This is an example of genetic drift, more specifically, the bottleneck effect. The remaining gene pool is different from the original. The data table shows us that the phenotypic frequencies changed between 1910 and 1925. We can find the change in allele frequency (and so change in gene pool) using the Hardy-Weinberg equation showing the values of p (frequency of dominant alleles) and q (frequency of recessive alleles) has changed significantly. • p(1910) = 0.06, or 6% of the total alleles in the population are dominant in 1910. • p(1925) = 0.86, or 86% of the total alleles in the population are dominant in 1925. • q(1910) = 0.94, or 94% of the total alleles in the population are recessive in 1910. • q(1925) = 0.14, or 14% of the total alleles in the population are recessive in 1925.
Learning Objective 1.1 Question 2 • Use statistical analysis to ensure that the alleles present in 1925 are due to the natural disaster and not just random chance. There are 1,000 total alleles present in the population. Accepted probability on chi square chart is 0.05. For a population of small forest trolls, the red allele is dominant to the purple allele. The habitat has no selection preference for either color.
Learning Objective 1.1 Question 2 • Confirm some or all of your conclusions for #1 by performing a chi-square test. The null hypothesis you are testing is that the observed and expected values are not significantly different from one another (because your expected values are calculated based on an assumption of Hardy-Weinberg equilibrium, this is the same as saying that the population is in H-W equilibrium for the genotype being tested). The critical value for the chi-square in this case is 3.841; if your calculated value of the chi-square is equal to or greater than that, the probability of the null hypothesis being correct (i.e., the probability of the population being in H-W equilibrium at that genotype) is 0.05 or less, and the null hypothesis is rejected.
Learning Objective # • Copy and paste your learning objective into this space
Learning Objective _____ Question 1 • Please write your question here
Learning Objective _____ Answer 1 • If room allows, copy and paste your question here, and make the font smaller to fit. • Please write your answer here
Learning Objective _____ Question 2 • Please write your question here
Learning Objective _____ Answer 2 • If room allows, copy and paste your question here, and make the font smaller to fit. • Please write your answer here
Learning Objective _____ Question 3 • Please write your question here
Learning Objective _____ Answer 3 • If room allows, copy and paste your question here, and make the font smaller to fit. • Please write your answer here
Learning Objective _____ Question 4 • Please write your question here
Learning Objective _____ Answer 4 • If room allows, copy and paste your question here, and make the font smaller to fit. • Please write your answer here