Download
1 / 9
90 likes | 105 Vues
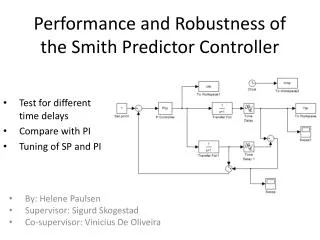
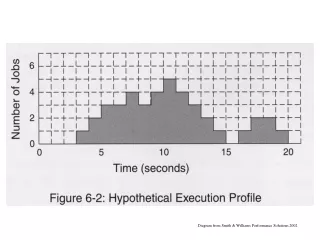
Explore the correlation between time and number of jobs completed with this informative diagram from Smith & Williams Performance Solutions 2002.

E N D