Hydrology Calibration
Hydrology Calibration. Phase 5. Calibrators. USGS-MD Jeff Raffensperger Sarah Martucci Joe Vrabel Angelica Gutierrez Gary Fisher. Calibrators. USGS-VA Doug Moyer Alan Simpson Jen Krstolic ICPRB Ross Mandel Julie Kiang. Calibrators. CBP Sara Brandt Jing Wu Kate Hopkins

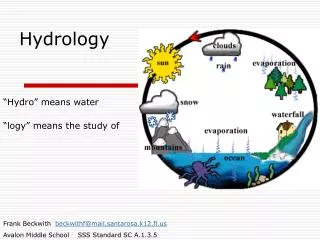
Hydrology Calibration
E N D
Presentation Transcript
Hydrology Calibration Phase 5
Calibrators • USGS-MD • Jeff Raffensperger • Sarah Martucci • Joe Vrabel • Angelica Gutierrez • Gary Fisher
Calibrators • USGS-VA • Doug Moyer • Alan Simpson • Jen Krstolic • ICPRB • Ross Mandel • Julie Kiang
Calibrators • CBP • Sara Brandt • Jing Wu • Kate Hopkins • Lewis Linker • Gary Shenk
Status from April • Reaching point of diminishing returns with hand calibration • Better and more consistent overall than phase4 • Consistent with other HSPF calibrations in the literature • Still a few small areas and issues that need attention in hydrology
Success with Hand Calibration • Generally better calibration than previous model • Discovered sensitive parameters • Discovered appropriate measures of performance
But . . . Individually Calibrated Parameters
But . . . Surface Runoff in inches/year
Individual basin AGWETP calibration But . . .
But . . . • Some land segments were not calibrated since they supply no monitored river • Ratios of parameters between land uses not preserved • Other established rules not followed
The good news: Calibration Measure HSPF Parameter Overall Bias Winter / Summer Balance Baseflow / Stormflow Balance Quickflow Recession Index Baseflow Recession Index Peak Bias land evap LZSN INFILT IRC AGWR INTFW
Iterative Calibration • Started with manual calibration • Enforced land use ratios • Enforced min and max • Used knowledge and statistics developed during the manual calibration • Assumed sensitivities linking parameters to statistics
Sensitivities Bias - land evap - LE = 2/(2-Bias) Wstat/Stat - LZSN - LZSN = (3-S/W)/2 Bstat - INFILT - INFILT = 1/Bstat QaveRI - IRC - IRC = 2/(1+QaveRI) BaveRI - AGWR - AGWR = 2/(1+BaveRI) Pbias/Vpbias - INTFW - INTFW = 1 + PorV/2
The Ratio Rules Crop SURO between 1 and 6
Link Land to River Basis: Percent of basin made up of each county County A is: 100% of station 1 50% of station 2 The ‘importance’ ratio is 2:1, so county A uses 2/3 of the station1 parameters and 1/3 station2 parameters Ignored ‘importances’ less that 10% Assigned ‘orphan’ counties to ‘siblings’ County A 50k acres Station 1 County B 50k acres Station 2
Baseflow / Stormflow Stat Fraction of flow that is baseflow (simulated) Bstat = 1 - Fraction of flow that is baseflow (observed) baseflow / total flow (simulated) Bstat = 1 - baseflow / total flow (observed) stormflow / total flow (simulated) Qstat = 1 - stormflow / total flow (observed)
Baseflow / Stormflow Recession Statistic average Simulated recession index Q rec Index = 1 - average Observed recession index quick flow tomorrow ) Average Recession index = Average ( quick flow today
Nash – Sutcliffe Model efficiency (variance of errors) (variance of observed) Computed for daily, log of daily, and monthly values. 1 -
Reported values of N-S efficiency • Often reported, but little information on ‘standards’ of efficiency • Reported daily efficiencies 0.5 - 0.75 • Reported daily log efficiencies 0.5 - 0.75 • Reported Monthly efficiencies 0.7 – 0.8
Reported values of N-S efficiency • Often reported, but little information on ‘standards’ of efficiency • Reported daily efficiencies 0.5 - 0.75 • Reported daily log efficiencies 0.5 - 0.75 • Reported Monthly efficiencies 0.7 – 0.8
Reported values of N-S efficiency • Often reported, but little information on ‘standards’ of efficiency • Reported daily efficiencies 0.5 - 0.75 • Reported daily log efficiencies 0.5 - 0.75 • Reported Monthly efficiencies 0.7 – 0.8
results Hand calib Iterative calib
Results • Used the knowledge gained during the individual calibration stage • Sensitive parameters • Important statistics • Improved the calibration by applying the knowledge in a systematic way • More consistent parameterization • Better statistical calibration
Remaining Questions • How robust is this calibration • Sensitive to starting point? • Sensitive to rules of assigning land segments to calibration stations? • Sensitive to rules governing parameters to adjust?
Effect of River Calibration Statistic to Land Parameter Methodology
Effect of River Calibration Statistic to Land Parameter Methodology
Effect of River Calibration Statistic to Land Parameter Methodology