Download
1 / 3
30 likes | 150 Vues
This analysis presents a comprehensive demographic profile of male and female enlistments in the military from various sources, highlighting trends among different racial and ethnic groups. Key findings indicate a predominance of Caucasian applicants, with notable representation from African American, Hispanic, and API/Other groups. The average age of enlistees is around 22-23 years, with education levels averaging around 12 years. Additionally, the study explores the ratio of single individuals among applicants and their average AFQT scores over varying enlistment terms.

E N D
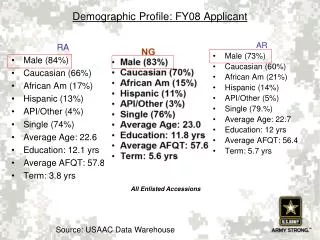
RA Male (84%) Caucasian (66%) African Am (17%) Hispanic (13%) API/Other (4%) Single (74%) Average Age: 22.6 Education: 12.1 yrs Average AFQT: 57.8 Term: 3.8 yrs AR Male (73%) Caucasian (60%) African Am (21%) Hispanic (14%) API/Other (5%) Single (79.%) Average Age: 22.7 Education: 12 yrs Average AFQT: 56.4 Term: 5.7 yrs Demographic Profile: FY08 Applicant All Enlisted Accessions Source: USAAC Data Warehouse
Male (83.3%) Caucasian (61.8%) African Am (4.9%) Hispanic (7.4%) Native Amer (1.4%) Asian Amer (5.8%) Other (1.9%) Female (16.7%) Caucasian (11.4%) African Am (1.2%) Hispanic (1.6%) Native Amer (.2%) Asian Amer (2.2%) Other (.2%) Demographic Profile: West Point Class of 2011 C Source: USAAC Data Warehouse
Male (75.1%) Caucasian (55.8%) African Am (7.3%) Hispanic (5%) Native Amer (1%) Asian Amer (3.1%) Other (2.9%) Female (24.9%) Caucasian (13.5%) African Am (6.2%) Hispanic (2.4%) Native Amer (.7%) Asian Amer (1%) Other (1.1%) Demographic Profile ROTC Class of 2011 AR, RA & NG combined Source: USAAC Data Warehouse