Fish barcoding from the FishTrace database:
Fish barcoding from the FishTrace database: The control gene, the data validation analysis and the backup reference biological data. FishTrace Consortium. José M. Bautista. DNA Barcoding of Life Sequencing billions of base pairs but first sampling millions DNAs.

Fish barcoding from the FishTrace database:
E N D
Presentation Transcript
Fish barcoding from the FishTrace database: The control gene, the data validation analysis and the backup reference biological data FishTrace Consortium José M. Bautista
DNA Barcoding of Life Sequencing billions of base pairs but first sampling millions DNAs From M. Blaxter, Nature (2003)
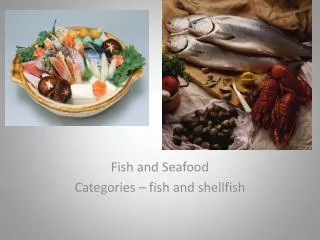
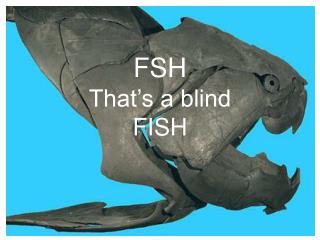
Fish > 30,000 teleost species (~ 60% of vertebrates) > 500 species consumed in Europe(FAO 2003) > 100 MTons world fish catch Practical - ecological interest "Marina con Pesci". Detail in a Mosaic found at Pompeii.
+ expert taxonomists Source of data for taxonomic identification • Dichotomic identification keys(e.g. FNAM, Whitehead, et al.1984-1986) • Fisheries field guides (e.g. FAO) • Fish systematics (e.g. Nelson, 1994) • Taxonomic databases (e.g. FishBase) • Molecular databases (e.g. GenBank)
Obstacles to reliable taxonomic fish identification • Definition of Standards: standard names and species covered • Methodology available • Control sample: Analytical data from standard (control) sample • Availability of regional samples • Availability of regional information • Adequate sample conservation for analysis (countercheck)
Fish barcoding scenario • 30,000 fish species • Sampling cost • Ad hoc sampling vs. random sampling • Regional divergence = regional sampling • Limited availability of taxonomic expertise
Fish barcoding relies on sampling: How many fish species will be available for DNA barcoding in 5 years?
Fish barcoding: Links taxonomic and molecular ID Trazability, population and fish species identification has been traditionally associated to molecular markers DNA: Restriction Fragments Lenght Polymorphisms (RFLP) Microsatellites (VNTR) Sequencing mitochondrial genes
Mitochondrial DNA is atradicional marker for species identification • Neutral marker • Multicopy: present in a large number atevery cell. • Evolutionary rate5 -10 times higher than nucleargenes. • Maternally inherited without genetic recombination. • The larger number of mtDNA sequences in GenBank from many fish species corresponds to rRNA16S, cyt b and COI
FishTrace www.fishtrace.org 2003-2006 Barcoding of European Marine Fish: Molecular ID + Taxonomy + Reference Collections in a single Database 2000: Pilot project in Canary Islands [92 species]: www.pescabase.org 2002: FishTrace Consortium: 10 European Institutions 2003: FishTrace starts as EC Project (January) 2006: FishTrace ends as EC Project (June)
FishTrace www.fishtrace.org Fishtrace in numbers: 3240specimens sampled: tissue taken for DNA analysis 9geographical sampling areas 5specimens/specie/area 221species [516 geo-overlapping] 2724total number of sequences
FishTrace www.fishtrace.org Molecular genetics Biological collections Taxonomy and sampling Standardization PCR + Sequencing Genetic Variation Methodological description Validation Standardization Storage Cataloging Sharing Validation Standardization Ad hoc Sampling Identification Local description Validation Database W W W
Biological collections Taxonomy and sampling Genetic Identification Rhod Cyt b Flow of information in the database for reliable fish identification • Sampling error (misidentified specimens): 2.1 % • Low quality DNA or inhibitors (no PCR amplification): 0.0 % • PCR not amplify one of the fragments (cytb or Rhod): 1.8 % • PCR or sequencing error: final sequence not matching phylogeny: 3.0 %
Fish DNA barcoding reliabilty in the FishTrace database upon: The control gene: Rhodopsin The data validation strategy: from taxonomy to sequence The backup reference biological data: from sequence to collections Trustworthiness to do what the system is designed to do
The control gene: Rhodopsin • Single copy • Nuclear gene that does not contains introns in Teleostei • Encodes a transmembrane G-protein-coupled receptor for visual transduction cascade • In fish, evolutionary rateis below 2-fold lower than cytbgene [0.167 vs 0.247] • Rhodopsin trees contains a high number of well supported Teleostei clades
The control gene: Rhodopsin The benefits • More information:When cytb is not obtained, rhodopsin is available • Increased Reliability: Branch consistency in Rhod and Cytb trees is a control of correct PCR and sequencing • Prediction:Unknown fish specimens with no representation in database are taxonomically well classified in phylograms from Cytb + Rhod + Cytb-Rhod. • Phylogenetic Performance: Rhod trees perform better than mtDNA trees with Teleostei clades
The data validation strategy:from taxonomy to sequence The online database Species data Specimen data General Info Regional Info Reference Sequences Genetic Variation Reference material Taxonomy + Biology DNA Sequences Biological Collections VALIDATION
The data validation strategy:from taxonomy to sequence The online database
The data validation strategy:from taxonomy to sequence The online database
The data validation strategy:from taxonomy to sequence The online database
The data validation strategy:from taxonomy to sequence The online database
The data validation strategy:specimen comparison of the collections
FishTrace Database: 82 Different PCR Conditions COMPLETE Cytb (20): CytB-IFRE_Direct cytBcp-IFRE_met1 cytBcp-IFRE_met11 cytBcp-IFRE_met12 cytBcp-IFRE_met20 cytBcp-IFRE_met21 cytBcp-IFRE_met7 cytBcp-IFRE_met8 cytBcp-NRM_Anguilla cytBcp-NRM_Gadus cytBcp-NRM_Scombrus cytBcp-NRM_Sebastes cytBcp-NRM_std cytBcp-RICO-TriEsm cytBcp-RIVO-Diclab cytBcp-RIVO-ScoSco cytBcp-RIVO-analup cytBcp-RIVO-pleuron. cytBcp-RIVO_TriLus cytBcp-Rivo_direct Cytb 5' (18): cytB5-IFRE_met1 cytB5-IFRE_met9 cytb5-IFRE_met14_dir cytb5-IFRE_met15 cytb5-IFRE_met17_dir cytb5-IFRE_met24 cytb5-IFRE_met27_dir cytb5-IFRE_met4 cytb5-IFRE_met5_dire cytb5-NAGREF cytb5-NAGREF1_direct cytb5-NRM_std cytb5-RIVO-CilCep cytb5-RIVO_pol cytb5-UCM_11 cytb5-UCM_12 cytb5-UCM_21 cytb5_direct_NS Cytb 3' (31): RIVO-cytb6/THR cytB3-IFRE_met10 cytB3-IFRE_met16_dir cytB3-IFRE_met18_dir cytB3-IFRE_met19 cytB3-IFRE_met2 cytB3-IFRE_met22 cytB3-IFRE_met23_dir cytB3-IFRE_met25 cytB3-IFRE_met26 cytB3-IFRE_met3 cytB3-IFRE_met6_dire cytB3-NAGREF-1 cytB3-NAGREF-2 cytB3-NAGREF-3 cytB3-NAGREF1_direct cytB3-NAGREF_MS cytB3-NRM_std cytB3-RIVO-Micpou cytB3-RIVO-MulSur cytB3-RIVO-cytb6/Tru cytB3-RIVO-melaeg cytB3-RIVO-pleuronec cytB3-RIVO_cytb7/THR cytB3-UCM_11 cytB3-UCM_12 cytB3-UCM_13 cytB3-UCM_14 cytB3-UCM_Mer1 cytB3-cytb7/truc cytB3_sol_NS Rhodopsin (13): rhod-IFRE_RO1-1 rhod-NAGREF rhod-NRM_flatfish rhod-NRM_std rhod-RIVO-F2-F4 rhod-RIVO-nested rhod-RIVO_mulsurDNA1 rhod-UCM_11 rhod-UCM_12 rhod-UCM_13 rhod-UCM_21 rhod-UCM_22 rhod-UCM_23
The data validation strategy:from taxonomy to sequence Standard Protocols Automated sequencing: ABI 3730 (real picture) 100% Efficiency 48 samples / 2 different primers / 96 reactions Sequencing chromatogram run (~800 bp) FishcytB-F CytBI-5R
The backup reference biological data: from sequence to collections
The backup reference biological data: from sequence to collections
The backup reference biological data: from sequence to collections
Biological collections Taxonomy and sampling Genetic Identification Rhod Cyt b Counterchecking Further genetic analysis Counterchecking Further genetic analysis Solea solea Microchirus azevia Trisopterus minutusTrisopterus minutus capellanus Combined information for fish identification Fish Barcoding Database + Specimen Identification
Combined information for fish identification Trisopterus minutusTrisopterus minutus capellanus TriMin-CB-02 TriMin-EM-04 SolSol-CS-02 MicAze-CI-04 Solea solea Microchirus azevia
Combined information for fish identification Sample/Specimen Identificación Diagnostic Tools Tailored to Users
FishTrace Database: Diagnostic Tools Tailored to Users: RFLP
Pollachius virens 100 57 Pollachius pollachius Gadus morhua 100 Merlangius merlangus 34 Melanogrammus aeglefinus 97 Micromesistius poutassou Trisopterus esmarkii 100 54 Sample EM0789 100 Trisopterus minutus 83 100 Gadiculus argenteus Brosme brosme 73 Molva molva 99 Phycis blennoides 100 Phycis phycis Merluccius polli 99 71 Merluccius merluccius 100 Merluccius capensis 100 Ciliata septentrionalis 62 Enchelyopus cimbrius Gaidropsarus biscayensis 98 Gaidropsarus mediterraneus 45 Oncorhynchus mykiss Engraulis encrasicolus 83 Gymnothorax afer 0.05 FishTrace Database: Sample/Specimen Identificación: TREE No. of Taxa : 24 No. of Groups : 3 Data Title : FishTrace Cytb+Rhod Data Type : Nucleotide Analysis : Phylogeny reconstruction Tree Inference : ============================== Method : Minimum Evolution Phylogeny Test and options : Bootstrap (1000 replicates) Search Options : CNI (level=1) with initial tree=NJ MaxTrees=1 Include Sites : ============================== Gaps/Missing Data : Pairwise Deletion Substitution Model : ============================== Model : Nucleotide: Kimura 2-parameter Substitutions to Include : d: Transitions + Transversions Pattern among Lineages : Same (Homogeneous) Rates among sites : Uniform rates No. of Sites : 1601
European Commission Acknowledgements Kees Groeneveld Mafalda Freitas João Delgado Rosa Pestana Fátima Hernández Alejandro De Vera Panos Leontarakis Laurence Favre-Krey Angeliki Adamidou Alexis Tsangridis Samuel Iglésias Mélyne Hautecoeur Romain Causse Laurent Nandrin Corinne Guchereau Amalia Diez Antonio Puyet Susana Pérez Jesús Soria Gema Escalera Gema González Hamid R. Ghanavi Daniel San Andrés Faye Taylor Delphine Ortega Romas Statkus Michael Norén Erik Alander Georg Fridriksson Anders Silfvergrip José I. Santana Ignacio J. Lozano José A. Pérez Antonio M. García Rosa Domínguez Montserrat Gimeno Fernanda Marrero Rocío González Miguel Rabassó Víctor M. Tuset Prudencio Calderín Laura Ramírez Marc Jérôme Olivier Mouchel Afne Stein Guy Duhamel Patrice Pruvost Grigorios Krey Sebastián Jiménez Manuel Biscoito Hilde Van Pelt Véronique Verrez Monique Etienne José A. González Sven O. Kullander Naouma Kourti Philippe Carreau Rafael G. Sevilla MNHN - Paris NAGREF - Kavala TFMC - Tenerife IMAR - Funchal RIVO - Ijmuiden IFREMER - Nantes ICCM - Las Palmas NRM - Stockholm JRC - Ispra UCM - Madrid