Download
1 / 6
60 likes | 196 Vues
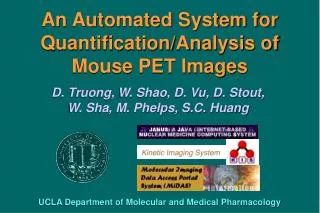
An Automated System for Quantification/Analysis of Mouse PET Images. D. Truong, W. Shao, D. Vu, D. Stout, W. Sha, M. Phelps, S.C. Huang. UCLA Department of Molecular and Medical Pharmacology. Design Objectives. Automate the analysis of mouse microPET/CT image data

E N D
An Automated System for Quantification/Analysis of Mouse PET Images D. Truong, W. Shao, D. Vu, D. Stout, W. Sha, M. Phelps, S.C. Huang UCLA Department of Molecular and Medical Pharmacology
Design Objectives • Automate the analysis of mouse microPET/CT image data • Extract ROIs, TACs, SUVs and biological parameters automatically • Adapt various scanners and platforms • Shorten the image analysis time and human errors • Easy and quick accessibility through the Internet UCLA Department of Molecular and Medical Pharmacology
Web Browser Automated Quantification/Analysis System of Mouse PET Images Infrastructure MicroCT Meta-database (microPET/CT, HPLC, wellcounter, etc.) Remove bed & chamber on CT image (1) Warp mouse CT image to DigiMouse (2) Warp mouse PET image to DigiMouse (3) Apply ROI template to PET image (4) Report Extract ROI values/TACs for major organs/tissues (5) Derive input function (7) Convert PET to SUVs and DVRs (6) Biological parameters (ROIs, TAC, SUV, rate constants, weight, injected dose, etc.) Use kinetic model fitting to determine parameters (8) Report generation (9) MicroPET User’s computer UCLA Department of Molecular and Medical Pharmacology
Web Browser Automated Quantification/Analysis System of Mouse PET Images Dataflow Diagram 3 2 1 Transformation Matrix 4,5 9 SUVs Meta Database/ Web Server 6 9 7 8 UCLA Department of Molecular and Medical Pharmacology Meta Database/ Web Server