Download
1 / 37
370 likes | 389 Vues
Learn about the criticality and risk of large cascading blackouts, identify thresholds for increased risk, and develop tools for monitoring. Understand the consequences of large blackouts and how they impact transmission system reliability.

E N D
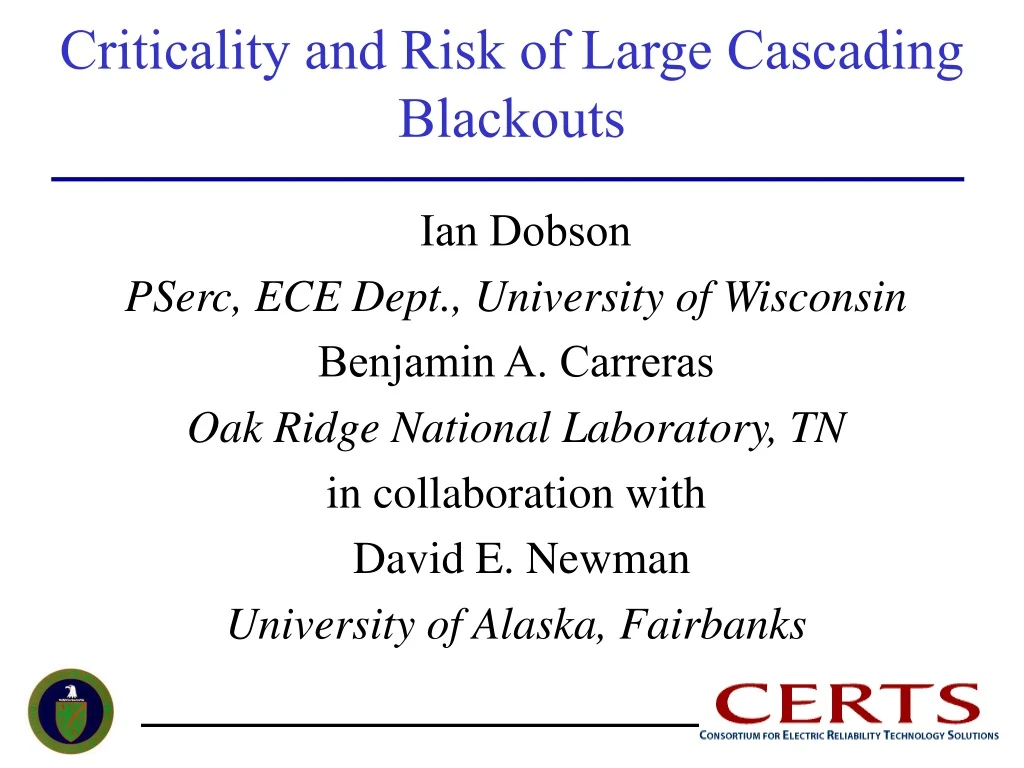
Criticality and Risk of Large Cascading Blackouts Ian Dobson PSerc, ECE Dept., University of Wisconsin Benjamin A. Carreras Oak Ridge National Laboratory, TN in collaboration with David E. Newman University of Alaska, Fairbanks
Goal Contribute to transmission system reliability byUnderstanding large, cascading failure blackouts andproviding tools for analyzing and monitoring their risk. In particular, the project will identify the threshold that leads to increased risk of cascading failure, express this threshold in terms of realistic power system parameters and develop monitoring tools and criteria to be applied in real power transmission systems.
Project History FY01-02 Team: ORNL and PSERC (Wisconsin,Cornell) Budget: 100K per year FY03-04 Team: ORNL and PSERC (Wisconsin) Budget: 110K per year Close collaboration between national lab and universities LEVERAGE: Collaboration with University of Alaska Collaboration with Christensen associates Funding from NSF
TOPICS • Challenges and costs of large blackouts • What is the risk of large blackouts? • Effect of overall loading on cascading failure • Criticality: Where is the ‘edge’ for cascading failure? • Monitoring closeness to criticality
Cascading failure; large blackouts • Rare, unanticipated, dependent events+ huge number of possibilities and combinations = hard to analyze or simulate • Mechanisms include: hidden failures, overloads, oscillations, transients, control or operator error, ... but all depend on loading
Detailed postmortem analysis of a particular blackout • arduous (months of simulation and analysis) but very useful • a basis for strengthening weak parts of system • motivates good practice in reliability:“Blackouts cause reliability”
General approach • Instead of looking at the details of individual blackouts, look at statistics and risk of series of blackouts • Global top-down analysis; look at bulk system properties. • Complementary to detailed analysis
Who pays the blackout cost? • Public and business. Halts the economy + indirect costs + harms other infrastructures • Utilities. Reputational, legal, regulatory costs, cost of upgrade or personnel to avoid similar blackouts • Government. Political risk
Blackout risk as size increases risk = probability x cost • Cost increases with blackout size.example: direct cost proportional to size • How does blackout probability decrease as size increases? … a crucial consideration for blackout risk!
power tail probability (log scale) -1 S -S e blackout size S (log scale) power tails have huge impact on large blackout risk. risk = probability x cost
If probability of blackout decreases as a power law with exponent near -1, then risk of large blackouts is comparable to (or even exceeding) the risk of small blackouts.
NERC blackout data • Major North American transmission outages over 15 years 1984-1998 • 427 blackouts • Data includes MW shed, restoration time, number of customers • Can process data to obtain frequency of blackouts in various size ranges and hence estimate probability distribution of blackout size
NERC blackout data shows power tail • Large blackouts more likely than expected • Conventional risk analysis tools do not apply; new approaches needed • Consistent with complex system near criticality • Large blackouts are rare, but have high impact and significant risk
More NERC data Number of blackouts with more than n customers affected plotted against n
log log plots Effect of Loading probability • VERY LOW LOAD- failures independent - exponential tails • CRITICAL LOAD- power tails • VERY HIGH LOAD- total blackout likely blackout size
CASCADE: A probabilistic loading-dependent model of cascading failure--- captures system weakeningas successive failures occur
CASCADE model • n identical components with random initial load uniform in [Lmin, Lmax] • initial disturbance D adds load to each component • component fails when its load exceeds threshold Lfail and then adds load P to every other component. Load transfer amount P measures component coupling, dependency • iterate until no further failures
CASCADE model • Key output is number of failed components • There is an analytic formula for the probability distribution of number of failed components as a function of parameters. • Captures some salient features of cascading failure in a tractable model.
example of application:modeling load increase - • Lmax = Lfail = 1 • increase average load L by increasing Lmin 1 L - - 0
<r> average # failures <r> versus average load L P=D=0.005 and n=100 critical load average load L
probability distribution asaverage load L increases probability number of failures
OPA blackout model summary • transmission system modeled with DC load flow and LP dispatch • random initial disturbances and probabilistic cascading line outages and overloads
Critical loading in OPA blackout model Mean blackout size sharply increases at critical loading; increased risk of cascading failure.
OPA model can match NERC data probability (August 14 blackout is consistent with this power tail) blackout size
Significance of criticality • At criticality there is a power tail, sharp increase in mean blackout size, and an increased risk of cascading failure. • Criticality gives a power system limit with respect to cascading failure. • How do we practically monitor or measure margin to criticality?
Ongoing research on margin to criticality • One approach is to increase loading in blackout simulation until average blackout size increases. • Another approach is to monitor or measure how much failures propagate (l) from real or simulated data.
CASCADE can be well approximated by a Galton-WatsonBranching Process
Branching from one failure … offspring failures a failure number of offspring ~ Poisson(l)mean number of failures = l
stage 4 Branching Process • each failure independently has random number of offspring in next stage according to Poisson(l) • l = mean number failures per previous stage failure • l = mean number of failures in stage k stage 3 stage 2 k stage 1 stage 0
Branching Process Facts l controls failure propagation • Subcritical case l<1:failures die out • Critical case l=1:probability distribution of total number of failures has power tail • Supercritical case l>1:failures can proceed to system size
Cumulative Line Trips from August 2003 Blackout Final Report
Implication for managing risk of cascading failure: design and operate system so that • < lmax < 1 need to monitor l can estimate risk of cascading failure from l
Current research • Measuring l from failure records (real or simulated). We are testing methods with OPA and also looking at real blackout data. • Relating abstract cascading models (branching/CASCADE) to OPA blackout model • Improving models to support above • Exploring and developing practical implications.
Context • We are suggesting adding an “increased risk of cascading failure” limit to usual power system operating limits such as thermal, voltage, transient stability etc. • Cascading failure limit measures overall system stress in terms of how failures propagate once started; complementary to measures to limit cascading failure by inhibiting start of cascade such as n-1, n-2 criterion.
KEY POINTS • NERC data shows relatively high risk of large blackouts • Criticality is the “edge” for increasing risk of cascading failure • We are developing practical tools to quantify and monitor propagation of failures and margin to criticality. • For more information see papers athttp://eceserv0.ece.wisc.edu/~dobson/home.html