Download
1 / 21
210 likes | 344 Vues
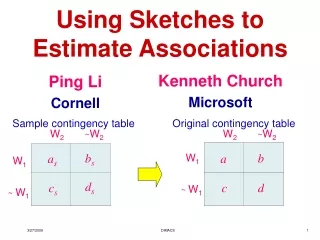
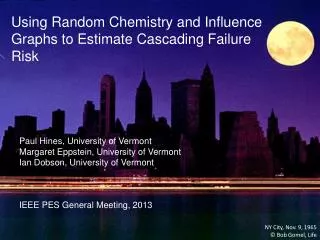
Using Random Chemistry and Influence Graphs to Estimate Cascading Failure Risk. Paul Hines, University of Vermont Margaret Eppstein , University of Vermont Ian Dobson, University of Vermont IEEE PES General Meeting, 2013. The research question .

E N D
Using Random Chemistry and Influence Graphs to Estimate Cascading Failure Risk Paul Hines, University of Vermont Margaret Eppstein, University of Vermont Ian Dobson, University of Vermont IEEE PES General Meeting, 2013
The research question • Is it possible to run a day-ahead (or even real time) calculation that would tell the operator: • (a) the risk of large blackouts due to combinations of failures and • (b) a small set of schedule changes that would dramatically reduce those risks?
For example... Reduce load on this line to cut risk in half
Why is CF modeling hard? • Cascading is complicated, with many mechanisms; e.g., • Thermal overloads, tree contact • Operator error • Relay mis-settings and errors • Dynamic instability • Voltage collapse (algebraic instability) • Some of these we can model with tractable models (cascading overloads). • Some require computationally expensive models (rotor dynamics). • Some are very hard to model (operators)
Why is CF risk estimation hard? • Cascades are typically triggered by unlucky combinations of events • August 2003: • Insufficient tree trimming causes several line trips, and • operator software failures • Sept. 2011: • Insufficient n-1 security analysis • Checklist error trips 500kV line. • The vast majority of combinations are benign • Errors, and line trips occur every day. • More evidence coming shortly... • Risk analysis requires us to find the ones that are not benign --- • To estimate risk, we need to find the malignant combinations (malignancies)
Outline for the rest of this talk • Introduction to the model that we used... • How can we find low-probability, high-impact malignancies in an n-1 secure system? • How do we transform the data that result into meaningful information about risk?
Part 1: Cascading Failure Simulation Paul Hines, University of Vermont Eduardo Cotilla-Sanchez
Illustration of our cascading failure simulator
Part 2: Finding Malignancies Paul Hines, University of Vermont
Random Chemistry Cascades are rare events that result from unlikely combinations of disturbances. How do we find enough combinations to say something statistically useful?
How do we find many combinations that trigger large blackouts? • Option 1: random search (Monte Carlo) • Advantage: unbiased • Disadvantage: 12,476 simulations to find each n-2 combination • Disadvantage: ~150,000 simulations to find each n-3 • Option 2: Biased search (importance sampling) • Use information (line flows) to bias the search. • Disadvantages: Outcomes will be biased; speedup tends to be modest • Option 3: Random Chemistry • Unbiased outcome within a given n-k (given k) • 151 simulations to find each n-2 • 251 simulations to find each n-3 • 471 simulations to find each n-4
# unique molecules/tube N O(Log2N) Eppstein’s RC alg. (Similar to depth- first search) N/2 N/4 N/8 • Each level is inherently parallelizable M
We used this to find many dangerous combinations 148,243 unique minimal n-k malignancies found in 735,500 successful RC trials 336 n-2 malignancies 25,059 n-3 malignancies 95,677 n-4 malignancies 27,171 n-5 malignancies
Most lines contribute to few malignancies, but a few contribute to most of them Number of times a branch appears in a malignancy
Part 3: Transforming the data into valuable information Paul Hines, University of Vermont
Data from cascading failure simulations can be transformed into influence graphs Credit: Ian Dobson
Estimating risk, using simulator S(c,x) • Complete enumeration • Monte Carlo • Random Chemistry (for a particular k)
Interesting (preliminary) risk results for Polish network, with SCOPF Risk (Expected Blackout size) Load (Percent of base case)
Conclusions • Creative application of ideas from other domains can lead to useful results • We are getting much closer to the point at which we can estimate cascading failure risk in real time, and give operators good advice about how to reduce that risk