Exploiting CO and CO2 Correlations for Enhanced Emission Estimates from China and Japan
This research delves into the correlations between CO and CO2 emissions from China's biomass burning, coal combustion, and other sources. By utilizing a bottom-up and top-down modeling approach, we assess regional variations and their implications for emission estimation accuracy. The GEOS-CHEM model is employed to analyze data from TRACE-P, revealing significant insights on anthropogenic emissions. This study advocates for leveraging these correlations to refine our understanding of emission sources and improve estimates of greenhouse gases, ultimately supporting better regional climate management strategies.

Exploiting CO and CO2 Correlations for Enhanced Emission Estimates from China and Japan
E N D
Presentation Transcript
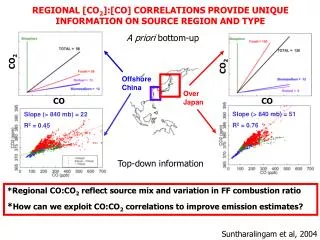
Offshore China Over Japan Slope (> 840 mb) = 22 R2 = 0.45 Slope (> 840 mb) = 51 R2 = 0.76 REGIONAL [CO2]:[CO] CORRELATIONS PROVIDE UNIQUE INFORMATION ON SOURCE REGION AND TYPE A priori bottom-up CO2 CO2 CO CO Top-down information *Regional CO:CO2 reflect source mix and variation in FF combustion ratio *How can we exploit CO:CO2 correlations to improve emission estimates? Suntharalingam et al, 2004
Modeling Approach Jacobian describes CTM y = Kxa + Forward model (GEOS-CHEM) Inverse model ^ x = xa + (KTSy-1K + Sa-1)-1 KTSy-1(y – Kxa) x = Fluxes of CO and CO2 from Asia (Tg C/yr) y = TRACE-P CO and CO2 concentration data State vector (Emissions x) Consistent CO and CO2 Emissions Observation vector y
GEOS-CHEM GEOS-CHEM Performance Remove CO2 bias using 10th percentile of [CO2]: 4-4.5 ppm 4-6 km TRACE-P Data 2-4 km CO [ppb] CO2 [ppm] 0-2 km Latitude [deg]
GEOS-CHEM All latitudes RRE Mean bias TRACE-P GEOS-CHEM 2x2.5 cell Altitude [km] CO Error specification for CO and CO2 Sy*Measurement accuracy *Representation *Model error (most important) SaAnthropogenic (c/o Streets) Biomass burning: 50% 30%Chemistry (~CH4): 25% Biosphere: 75% RRE = total observation error (y*RRE)2 ~38ppb (CO) ~1.87ppm (CO2) (measured-GEOS-CHEM) /measured
Uncorrelated inversion of CO and CO2 emissions Anthropogenic CO2 Biospheric CO2 CO2 emissions [Tg yr-1] CO2 emissions [Tg March 2001] Anthropogenic CO A priori A posteriori K ~ CO emissions [Tg yr-1] Results consistent with CO inverse modeling and [CO2]:[CO] analysis 1
Origin of CO:CO2 Correlations Coal-burning cook stoves in Xian, China warm air cold air E.g., frontal system Compute [CO]:[CO2] correlations from TRACE-P Colocated Emissions Atm. Dyn. Processes Emissions (Tg C yr-1) Emission Factor (TgC / Tg fuel) E = AF Activity Rate (Tg fuel yr-1) (amount of fuel burned) Sa Sy
ECO = (A + AA) (FCO + COFCO) ECO2 = (A + AA) (FCO2 + CO2FCO2) N CO:CO2 correlation China + Taiwan China N 1 Frac. FCO A posteriori certainty relative to uncorrelated inversion [%] CHINA 1 0.1 Frac. A -1 -0.5 0 0.5 1 Modeling CO and CO2 emission correlations