

SlideServe
Menu
Préférences
© SlideServe · v2026

T l B r

edythe avatar
9 diapositives · 257 Views · Oct 15, 2014

V. Gostilo 1 , A. Owens 2 , M. Bavdaz 2 , I . Lisjutin 1 , A. Peacock 2 , H. Sipila 3 , S. Zatoloka 1 1 Baltic Scientific Instruments Ganibu dambis 26, P. O. Box 33, LV-1005, Riga, Latvia 2 Astrophysics Division ESA/ESTEC Postbus 299, 2200AG Noordwijk , The Netherlands
T l B r - slide 1
01 / 9T l B r
1 / 17

Télécharger la présentation

T l B r
Une image / un lien ci-dessous est fourni (tel quel) pour télécharger la présentation

Politique de téléchargement : le contenu du site vous est fourni TEL QUEL pour votre information et votre usage personnel ; il ne peut être vendu, concédé sous licence ni partagé sur d’autres sites sans l’accord de son auteur.Le contenu vous est fourni TEL QUEL, pour votre information et votre usage personnel uniquement. Téléchargez la présentation en cliquant sur ce lien. Lors du téléchargement, si vous ne parvenez pas à télécharger une présentation, l’éditeur a peut-être supprimé le fichier de son serveur.Pendant le téléchargement, si vous ne parvenez pas à obtenir une présentation, le fichier a peut-être été supprimé par l’éditeur.

F I N

Plus de contenu associé

Transcription de la présentation
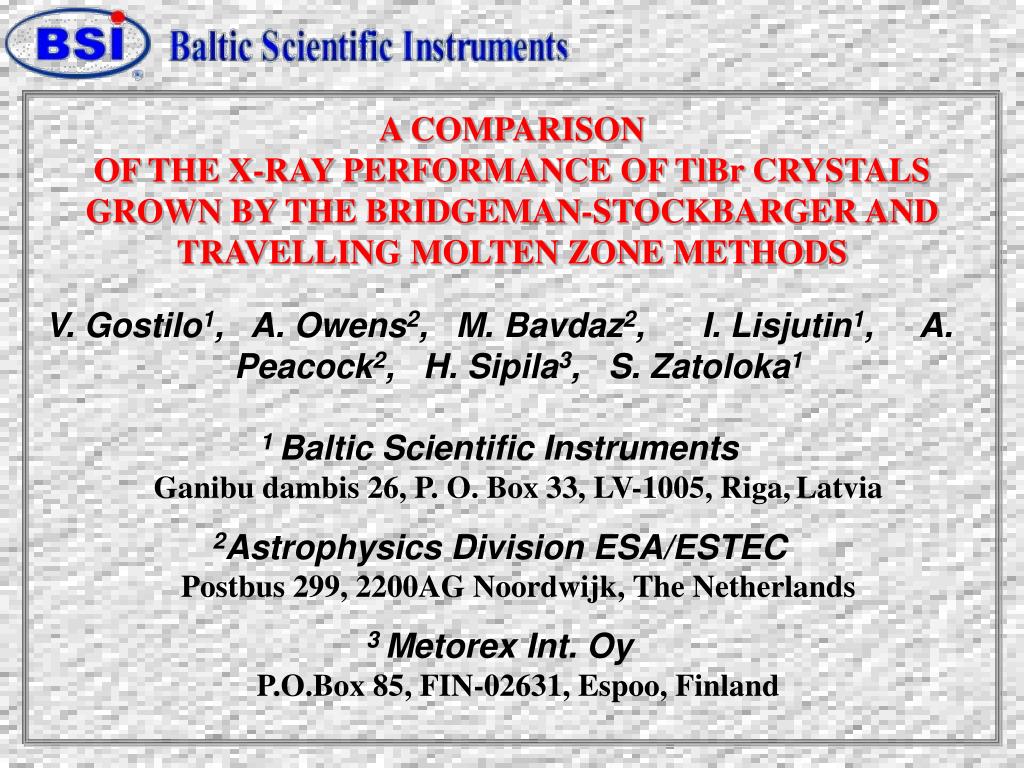
  1. V.Gostilo1, A.Owens2, M.Bavdaz2,I. Lisjutin1, A.Peacock2, H.Sipila3, S.Zatoloka1 1Baltic Scientific InstrumentsGanibu dambis 26, P.O.Box 33, LV-1005,Riga,Latvia 2Astrophysics DivisionESA/ESTEC Postbus 299, 2200AG Noordwijk, The Netherlands 3Metorex Int.OyP.O.Box 85, FIN-02631, Espoo, Finland A COMPARISON OF THE X-RAY PERFORMANCEOF TlBr CRYSTALS GROWN BY THE BRIDGEMAN-STOCKBARGER ANDTRAVELLING MOLTEN ZONE METHODS

  2. T l B r Bandgap – 2,678 eV Atomic number – Tl-81, Br-35 Density –7.5 g/cm3 Bridgeman-Stockbarger method Traveling Molten Zone method

  3. TABLE 1 The electrical and transport characteristics of the crystals grown by the two methods

  4. Spectrum of the source Am-241, registered by the detector J2 ata temperature –15°С and a bias of +500V. 1.14 keV 2.5 keV 1.37 keV 7.89 keV Spectrum of the source Am-241, registered by the detector J2 ata temperature –15°С and a bias of -500V.

  5. Spectrum of the source Cd-109, registered by the detector J2 ata temperature –15°С and a bias of +500V. 3.3 keV

  6. Spectrum of the source Co-57, registered by the detector J2 attemperature –15°С and a bias of +500V. 4.4 keV

  7. Spectrum of the source Cs-137, registered by the detector J2 attemperature –15°С and a bias of +50V. 27.7 keV

  8. TABLE 2The best resolution values (in keV) obtained at various energies

  9. CONCLUSIONS • Spectroscopic performance for detector crystals growth by both methods is compatible. • Further improvement of growth technology is required. • Efforts should be aimed at the improvement of transport characteristics. • The nature of carrier trapping should be clarify. Acknowledgments The authors thank Dr. K. Hitomi (Tohoku Institute of Technology, Japan) for providing crystals for test and evaluation and for valuable discussions.