Download
1 / 53
530 likes | 532 Vues
Explore the economic growth and job opportunities in the Inland Empire region of California, including the impact of petroleum prices, wage and salary employment, health care jobs, warehousing, manufacturing, construction, and the office space market.

E N D
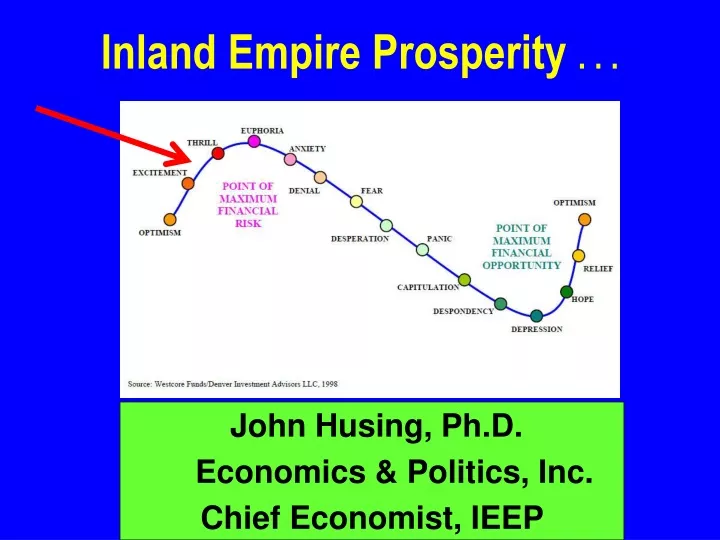
Inland Empire Prosperity . . . John Husing, Ph.D. Economics & Politics, Inc. Chief Economist, IEEP
After Losing 8.71 Million Jobs …U.S. Jobs Long Slow Growth - Not Over-Heating
Petroleum Prices Helps Families In Modest Income Areas
Value of the Dollar:Helps Imports & Hurts Exports 100.0 23.6%
Consumer Confidence, 2009-2015 Needed To Help Homes Sales
California Job Gains/Losses Up +875,333 82.4% Up 2008-2010 -1,062,758 2011-2015 +1,938,092 Recovery Great Recession
Very Rapid Job Growth: 3 Straight Years! 2011-2016p Gained Back 250,502 vs. 142,933 Lost 107,576More Jobs Will Have Been Created!
Inland Empire Growth was the 2nd LargestAbsolute Job Gain in California in 2014!
Gold Mine Theory Secondary Tier Primary Tier
Educational Challenge For Adults & Their Children Time To Stop Talking & Do Something About This!
Health Care Jobs: Continuous Growth 2011-2015 12% of Job Growth Median Pay $54,261
Inland Empire Underserved by Health Care Workers 27.7% More People Per Health Care Worker in 2014 36.5% More People Per Health Care Worker in 2010
Port Container VolumesStrong Even With January Labor Slowdown
Net Industrial Space Absorption 19.6 million
Logistics Incredibly Important To Inland Empire’s Economic Health 2011-2015 Mary 23% of New Jobs Remember: Every Gold Mine Job Also Funds Another Secondary Tier Job Median Pay $45,677
PM 2.5: Diesel Pollution -95.6%
Inland Empire Manufacturing Jobs 2011-2015 4% of Job Growth Median Pay $49,567
Notices of Default At Low Levels (873 in August 2015) Negative Equity Has Dropped 4th Qtr 2009 - 2nd Qtr 2015 54.9% to 12.3%
Home Price Trends -26.9% 83.5%
Affordability to Median Income Household2nd Quarter 2015 I. Empire: 46%-54% LA: 30%-70% SD: 25%-75% Orange: 20%-80%
The Future: Survey of 1,600 MillennialsLong Term Goals • 66% want to live in the suburbs • 24% want to live in rural areas • 10% want to live in a city center • Want to live in more space than they have now • 81% want three or more bedrooms in their home
Construction Jobs: Finally Growing 2011-2015 11% of Job Growth Median Pay $51,051
Higher End Homes Draw Well Educated Workers UPLAND $484,409 $463,034 Claremont Loma Linda $590,000 $360,087 $351,504 $417,443 $585,199 EASTVALE $468,269 $440,000 CORONA $436,898 TEMECULA $358,516 $399,676
Professionals, Mgmt., Utilities, Information, Mining Slowly Coming Back 2011-2015 4.1% of Growth Median Pay $65,453
Office Space Net Absorption 492,858
Office Vacancy Rate 15.0%
Gold Mine Theory Secondary Tier Primary Tier
Low Paying Job GrowthRetail, Consumer & Bus. Services, Hotel, Eat & DrinkAmusement, Agriculture, Employment Agency 2011-2015 45% of Job Growth Median Pay $28,927