Download
1 / 16
160 likes | 352 Vues
PSU NASA Team Final Report. Chris Churchill Chantelle Hansen Nathan Joy Matthew Thomas Faculty Advisors: Dr. Graig Spolek Dr. Mark Weislogel. Presentation Overview. Mission Statement Design Process PDS Summary Final Design Summary Summary. Mission Statement.

E N D
PSU NASA TeamFinal Report Chris Churchill Chantelle Hansen Nathan Joy Matthew Thomas Faculty Advisors: Dr. Graig Spolek Dr. Mark Weislogel
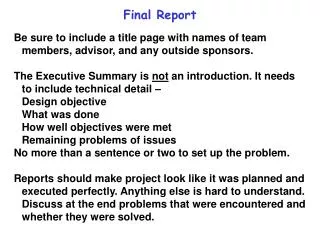
Presentation Overview • Mission Statement • Design Process • PDS Summary • Final Design Summary • Summary
Mission Statement To test the effects on flow regimes and rivulet coalescence of noncircular cross-section conduits in microgravity by varying the interior corner and testing them across a range of air to water ratios.
Design ProcessInitial Concept Schematic for low-g apparatus.
Project Design Specification Summary • Performance: Equivalent hydraulic diameter and flow rates to previous research. • Environment: Function in micro-g environment and withstand up to 2 g’s. • Installation: Experiment is electrically & mechanically compatible with the aircraft. • Safety/reliability: Have safety factor greater than 2. • External Constraints: Satisfy requirements for PSU Capstone Project and NASA. • Timelines: Low-g rig completed and shipped to Houston by June 3rd.
Final Design Summary: Performance To prove that the flow rates are the same as Barajas: Water flow • Linear syringe pump provides a known constant flow Air Flow • Hot film anemometer mounted in a pipe to measure air velocities from 1 m/s to 50 m/s.
Final Design Summary: Performance Rivulet Flow Slug Flow Plug Flow
Final Design Summary Environment • Structural analysis was performed on all components to verify the low-g rig can withstand up t0 2 g’s
Final Design Summary Installation • Cargo tie-down straps are used to ensure mechanical compatibility. • Experiment is electrically compatible.
Final Design Summary Safety/reliability: • Ensure all components have a safety factor greater than 2. • Verify that enclosure can withstand up to 9 g’s.
Summary • All requirements set by NASA and PSU have or will be met. • All construction of the apparatus is complete and ready for shipment to Houston. • Trials of the apparatus in 1-g indicate that the low-g tests should produce good flow results. • In one week, we will verify whether the NASA low-g aircraft will live up to its moniker.