Download
1 / 65
650 likes | 826 Vues
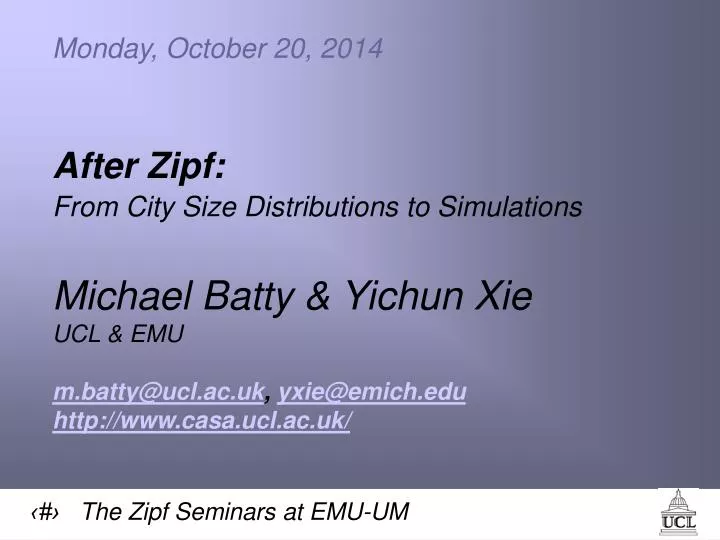
Monday, October 20, 2014 After Zipf: From City Size Distributions to Simulations Michael Batty & Yichun Xie UCL & EMU m.batty@ucl.ac.uk , yxie@emich.edu http://www.casa.ucl.ac.uk/. 1.What is the Notting Hill Carnival

E N D
Monday, October 20, 2014 After Zipf: From City Size Distributions to Simulations Michael Batty & Yichun Xie UCL & EMU m.batty@ucl.ac.uk, yxie@emich.edu http://www.casa.ucl.ac.uk/
1.What is the Notting Hill Carnival A Two day Annual event based on a street parade and street concerts in inner London which is a celebration of West Indian ethnic culture. Started in 1964 as The Notting Hill Festival; attracting 150,000 people by 1974 It attracts up to 1 million visitors and spreads over an are of about 3.5 sq miles Here are some pictures
Scaling in Urban Systems: A Brief History 1. Gravitational analogies - Ravenstein (1888) for migration, Carey (1850), French Physiocrats 2. The Emergence of Social Physics from the 1940s on - Regional Science in the 1950s 3. The simplest scaling - Zipf’s Law - the rank size rule 4. Transportation Modeling 5. Scaling in terms of fractals from the 1980s on
Zipf’s Law and the Distribution of Populations in Systems of Cities 1. Zipf’s Law - the rank size rule 2. The confusion over its formulation as a probability distribution 3. The original emphasis on description 4. Most examples took the largest events known such as the top 100 world cities as defined from yearbooks etc 5. There is hardly any attention to what these events really mean
A Typical Distribution for World Population in 1994 Here we have 150 countries and we will show how difficult it can be from this kind of data to demonstrate scaling
Log Population against Log Rank The King or Primate City Effect Scaling only over restricted orders of magnitude A different regime in the thin tail Log Population Log Rank
Problems 1. Scaling - many indeed most distributions are not power functions 2. The events are not independent - in medieval times they may have been but for the last 200 years, cities have grown into each other, nations have become entirely urbanized, and now there are global cities - the tragedy in NY tells us this - where more than half of those killed were not US citizens 3. Should we expect scaling ? We know that cities depend on history as well as economic growth
Problems (continued) 4. Why should we expect no characteristic length scale - when the world is finite ? We should avoid the sin of ‘Asymptopia’. 5. As scaling is often said to be the signature of self-organization, why should we expect disparate and distant places to self-organize ? 6. The primate city effect is very dominant in historically old countries 7. BUT should we expect these differences to disappear as the world become global ?
Let’s first look at arbitrary events - An Example for the UK based on Administrative Units, not on trying to define cities as separate fields These are 458 admin units, somewhat less than full cities in many cases and some containing towns in county aggregates - we have data from 1901 to 1991 so we can also look at the dynamics of change - traditional rank size theory says very little about dynamics
1991 1901 Log of Population Log of Rank
This is what we get when we fit the rank size relation Pr=P1 r - to the data. The parameter is hardly 1 but it is more than 0.36 which was the value for world population in 1994
Here is an example of the shift in size and ranks over the last 100 years in GB 1901 1991 Log of Population Shares 1991 Population based on 1901 Ranks Log of Rank
Explaining City Size Distributions Using Multiplicative Processes The last 10 years has seen many attempts to explain scaling distributions such as these using various simple but stochastic processes. In essence, the easiest which gives rise to distributions such as these is a model of proportionate effect or growth which leads to the lognormal distribution
The key idea is that the change in size of the object in question is proportional to the size of the object and randomly chosen, that is This leads to the log of differences across time being a function of the sum of random changes This gives the model of proportionate effect or
Here’s a simulation which shows that the rank-size rule is generated this way with much the same properties as the observed data for UK t=1000 t=900 Log of Population Shares t=1000 Population based on t=900 Ranks Log of Rank
This is a good model to show the persistence of settlements, it is consistent with what we know about urban morphology in terms of fractal laws, but it is not spatial. However there are other processes which we should note which have been explored. I will list these as follows - and please note that my survey is by no means exhaustive.
Other Stochastic Processes which have been used to explain scaling 1. The Simon model - birth processes are introduced which is not something which is done in generating the lognormal 2. Multiplicative random growth with constraints on the lowest size - size is not allowed to become too small otherwise the event is removed 3. Work on growth rates consistent with scaling relations involving Levy distributions
The Second Example - distributions where the events are unambiguous or less ambiguous - the distribution of links on WWW Here we take a look at the distribution of indegrees and outdegrees formed by links relating to web pages - a web page is pretty unambiguous. There is a lot of work on this produced during the last three years, notably the Xerox Parc group & the Notre Dame group
Number of Web Pages and Total Links - indegrees and outdegrees These are taken from relevant searches of AltaVista for 180 domains in 1999
Links as indegrees and outdegrees compared to the Total Links
Number of Web Pages,Total Links, GDP and Total World Populations
These are based on the general formula where q is the parameter of the distribution As a general conclusion, it does not look as though the event size issue has much to do with the scaling or lack of it.We urgently need some work on spatial systems with fixed event areas, thus shifting the focus to densities not distributions
The internet is a great example - the densest nodes are in the places where all the information is concentrated - in the world cities - in short, distances and locations in cyberspace mirror real space - biggest hubs are in Manhattan, City of London and so on e.g.
Last Comments and Future Work Scaling can be shown to be consistent with more micro-based , hence richer less parsimonious models 1. Diffusion and growth models 2. Agent-based competition models 3. Treating the system as a growing network - this latter model is worth finishing with as it is particularly relevant to the WWW and is probably close to interaction models of cities as in transportation
Network Approaches to Scaling Here we take a look at the distribution of indegrees and outdegrees formed by links relating to web pages - a web page is pretty unambiguous. There is a lot of work on this produced during the last three years, notably the Xerox Parc group & the Notre Dame group let me start with some notions of about graphs
On the left a random graph, whose distribution of the numbers/density of links at each node is near normal - this has a characteristic length - the average On the left, what is much more typical - a graph which is scaling - one whose distribution is rank size, following a power law P(k) ~ k - 2.5
Not only does the topology of web pages follow power laws so does the physical hardware - the routers and wires This and the last diagram are taken from the article by Barabasi called “The Physics of the Web” printed in the July 2001 issue of Physics World
Here is some work that Steve Coast in our group at CASA is doing on detecting and measuring the distribution of the hardware of the web and visualizing it - all this is prior to measuring its properties - i.e. is it scaling, is it a small world and so on Challenge is to map real space onto cyberspace and that so far has not really been attempted in these new ideas about how network systems grow This is the cluster of routers, and hubs and machines in UCL
Some statistics from Steve’s work - which imply scale free networks Lots and lots of issues here - we need models of how networks grow and form, how does the small world effect mesh into scale free networks ? We need to map cyberspace onto real space and back, and this is no more than mapping social space onto real space and back - its not new. I will finish
Some of the most interesting work is being done in virtual space - in cyberspace not in real space. Here is an example of such a network
Some references - Martin Dodge and Rob Kitchin’s new book Steve Coast’s web site www.fractalus.com/steve/ Our web site www.casa.ucl.ac.uk and drill down to get to Martin’s www.cybergeography.org
World-216 countries R-sq = 0.708 b = -2.26 USA-3149 cities R-sq = 0.992 b = -0.81 Mexico-36 cities R-sq = 0.927 b = -1.27 UK-459 areas R-sq = 0.760 b = -0.58
Figure 1: Rank-Size Distributions of Highly Cited Scientists
where is the number of cited scientists at rank is the mean number of cited scientists, and is the number of institutions, places, or countries for each of the three respective aggregations6