Exploring Motion: Illustrated Concepts and Diagrams for Understanding
Explore the principles of motion representation in Physics Chapter 2, from position-time graphs to motion diagrams. Learn how to depict an object's movement through displacement and velocity. See various motions illustrated in diagrams and read about practical applications with clear explanations. Understand the significance of coordinate systems in motion descriptions and how time intervals and displacement play a crucial role. Enhance your knowledge of motion with essential questions, new vocabulary, and detailed diagrams.

Exploring Motion: Illustrated Concepts and Diagrams for Understanding
E N D
Presentation Transcript
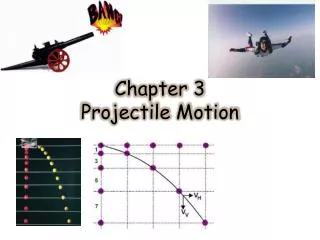
PHYSICS Principles and Problems Chapter 2: Representing Motion
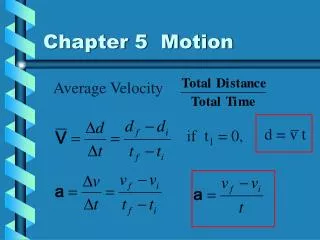
Representing Motion CHAPTER2 BIG IDEA You can use displacement and velocity to describe an object’s motion.
Table Of Contents CHAPTER2 Section 2.1 Picturing Motion Section 2.2 Where and When? Section 2.3 Position-Time Graphs Section 2.4 How Fast? Click a hyperlink to view the corresponding slides. Exit
Picturing Motion SECTION2.1 MAIN IDEA You can use motion diagrams to show how an object’s position changes over time. • How do motion diagrams represent motion? • How can you use a particle model to represent a moving object? EssentialQuestions
New Vocabulary Motion diagram Particle model Picturing Motion SECTION2.1 • Review Vocabulary • Model a representation of an idea, event, structure or object to help people better understand it.
Picturing Motion SECTION2.1 All Kinds of Motion • Perceiving motion is instinctive—your eyes pay more attention to moving objects than to stationary ones. Movement is all around you. • Movement travels in many directions, such as the straight-line path of a bowling ball in a lane’s gutter, the curved path of a tether ball, the spiral of a falling kite, and the swirls of water circling a drain.
Picturing Motion SECTION2.1 All Kinds of Motion (cont.) • When an object is in motion, its position changes. Its position can change along the path of a straight line, a circle, an arc, or a back-and-forth vibration.
Picturing Motion SECTION2.1 All Kinds of Motion (cont.) • Straight-line motion follows a path directly between two points without turning left or right. • Ex. Forward and backward, up and down, or north and south. • A description of motion relates to place and time. You must be able to answer the questions of where and when an object is positioned to describe its motion.
Picturing Motion SECTION2.1 Motion Diagrams Click image to view movie.
Section Check SECTION2.1 Explain how applying the particle model produces a simplified version of a motion diagram?
Section Check SECTION2.1 Answer Answer:Keeping track of the motion of the runner is easier if we disregard the movements of the arms and the legs, and instead concentrate on a single point at the center of the body. In effect, we can disregard the fact that the runner has some size and imagine that the runner is a very small object located precisely at that central point. A particle model is a simplified version of a motion diagram in which the object in motion is replaced by a series of single points.
Section Check SECTION2.1 Which statement describes best the motion diagram of an object in motion? A. a graph of the time data on a horizontal axis and the position on a vertical axis B. a series of images showing the positions of a moving object at equal time intervals C. a diagram in which the object in motion is replaced by a series of single points D. a diagram that tells us the location of the zero point of the object in motion and the direction in which the object is moving
Section Check SECTION2.1 Answer Reason:A series of images showing the positions of a moving object at equal time intervals is called a motion diagram.
Section Check SECTION2.1 What is the purpose of drawing a motion diagram or a particle model? A. to calculate the speed of the object in motion B. to calculate the distance covered by the object in a particular time C. to check whether an object is in motion D. to calculate the instantaneous velocity of the object in motion
Section Check SECTION2.1 Answer Reason:In a motion diagram or a particle model, we relate the motion of the object with the background, which indicates that relative to the background, only the object is in motion.
Where and When? SECTION2.2 MAIN IDEA A coordinate system is helpful when you are describing motion. • What is a coordinate system? • How does the chosen coordinate system affect the sign of objects’ positions? • How are time intervals measured? • What is displacement? • How are motion diagrams helpful in answering questions about an object’s position or displacement? Essential Questions
New Vocabulary Coordinate system Origin Position Distance Magnitude Where and When? SECTION2.2 • Review Vocabulary • Dimension extension in a given direction;one dimension is along a straight line; three dimensions are height, width and length. • Vector • Scalar • Time interval • Displacement • Resultant
Where and When? SECTION2.2 Coordinate Systems • A coordinate system tells you the location of the zero point of the variable you are studying and the direction in which the values of the variable increase. • The origin is the point at which both variables have the value zero.
Where and When? SECTION2.2 Coordinate Systems (cont.) • In the example of the runner, the origin, represented by the zero end of the measuring tape, could be placed 5 m to the left of the tree.
Where and When? SECTION2.2 Coordinate Systems (cont.) • The motion is in a straight line, thus, your measuring tape should lie along that straight line. The straight line is an axis of the coordinate system.
Where and When? SECTION2.2 Coordinate Systems (cont.) • You can indicate how far away an object is from the origin at a particular time on the simplified motion diagram by drawing an arrow from the origin to the point representing the object, as shown in the figure.
Where and When? SECTION2.2 Coordinate Systems (cont.) • The two arrows locate the runner’s position at two different times. • Because the motion in the figure below is in one direction, the arrow lengths represent distance.
Where and When? SECTION2.2 Coordinate Systems (cont.) • The length of how far an object is from the origin indicates its distancefrom the origin.
Where and When? SECTION2.2 Coordinate Systems (cont.) • A position 9 m to the left of the tree, 5 m left of the origin, would be a negative position, as shown in the figure below.
Where and When? SECTION2.2 Vectors and Scalars • Quantities that have both size, also called magnitude, and direction, are called vectors, and can be represented by arrows. • Vector quantities will be represented by boldface letters. • Quantities that are just numbers without any direction, such as distance, time, or temperature, are called scalars. • Scalars quantities will be represented by regular letters.
Where and When? SECTION2.2 Vectors and Scalars (cont.) • The difference between the initial and the final times is called the time interval.
Where and When? SECTION2.2 Vectors and Scalars (cont.) • The common symbol for a time interval is ∆t, where the Greek letter delta, ∆, is used to represent a change in a quantity.
Where and When? SECTION2.2 Vectors and Scalars (cont.) • The time interval is defined mathematically as follows: • Although i and f are used to represent the initial and final times, they can be initial and final times of any time interval you choose. • The time interval is a scalar because it has no direction.
The figure below shows the position of the runner at both the tree and the lamppost. These arrows have magnitude and direction. Position is a vector with the arrow’s tail at the origin and the arrow’s tip at the place. Where and When? SECTION2.2 Vectors and Scalars (cont.)
The symbol x is used to represent position vectors mathematically. Xirepresents the position at the tree, xf represents the position at the lamppost and ∆x, represents the change in position, displacement, from the tree to the lamppost. Where and When? SECTION2.2 Vectors and Scalars (cont.)
Displacement is defined mathematically as: Remember that the initial and final positions are the start and end of any interval you choose, so a plus and minus sign might be used to indicate direction. Where and When? SECTION2.2 Vectors and Scalars (cont.) ∆x = xf - xi
Where and When? SECTION2.2 Vectors and Scalars (cont.) • A vector that represents the sum o f two other vectors is called a resultant. • The figure to the right shows how to add and subtract vectors in one dimension.
Where and When? SECTION2.2 Vectors and Scalars (cont.) • To completely describe an object’s displacement, you must indicate the distance it traveled and the direction it moved. Thus, displacement, a vector, is not identical to distance, a scalar; it is distance and direction. • While the vectors drawn to represent each position change, the length and direction of the displacement vector does not. • The displacement vector is always drawn with its flat end, or tail, at the earlier position, and its point, or tip, at the later position.
Section Check SECTION2.2 Differentiate between scalar and vector quantities.
Section Check SECTION2.2 Answer Reason: Quantities that have both magnitude and direction are called vectors, and can be represented by arrows. Quantities that are just numbers without any direction, such as time, are called scalars.
Section Check SECTION2.2 What is displacement? A.the vector drawn from the initial position to the final position of the motion in a coordinate system B. the distance between the initial position and the final position of the motion in a coordinate system C. the amount by which the object is displaced from the initial position D. the amount by which the object moved from the initial position
Section Check SECTION2.2 Answer Reason:Options B, C, and D are all defining the distance of the motion and not the displacement. Displacement is a vector drawn from the starting position to the final position.
Section Check SECTION2.2 Refer to the adjoining figure and calculate the time taken by the car to travel from one signal to another signal? C. 25 min D. 5 min A. 20 min B. 45 min
Section Check SECTION2.2 Answer Reason: Time interval t = tf – ti Here tf = 01:45 and ti = 01:20 Therefore, t = 25 min
Position-Time Graphs SECTION2.3 MAIN IDEA You can use position-time graphs to determine an object’s position at a certain time. • What information do position-time graphs provide? • How can you use a position-time graph to interpret an object’s position or displacement? • What are the purposes of equivalent representations of an object’s motion? Essential Questions
New Vocabulary Position-time graph Instantaneous position Position-Time Graphs SECTION2.3 • Review Vocabulary • Intersection a point where lines meet and cross.
Position-Time Graphs SECTION2.3 Finding Positions Click image to view movie.
Position-Time Graphs SECTION2.3 Finding Positions (cont.) • Graphs of an object’s position and time contain useful information about an object’s position at various times. It can be helpful in determining the displacement of an object during various time intervals.
Position-Time Graphs SECTION2.3 Finding Positions (cont.) • The data in the table can be presented by plotting the time data on a horizontal axis and the position data on a vertical axis, which is called a position-time graph.
Position-Time Graphs SECTION2.3 Finding Positions (cont.) • To draw the graph, plot the object’s recorded positions. Then, draw a line that best fits the recorded points. This line represents the most likely positions of the runner at the times between the recorded data points. • The symbol x represents the instantaneous position of the object—the position at a particular instant.
Position-Time Graphs SECTION2.3 Finding Positions (cont.) • Words, pictorial representations, motion diagrams, data tables, and position-time graphs are all representations that are equivalent. They all contain the same information about an object’s motion. • Depending on what you want to find out about an object’s motion, some of the representations will be more useful than others.
Position-Time Graphs SECTION2.3 Multiple Objects on a Position-Time Graph In the graph, when and where does runner B pass runner A?
Position-Time Graphs SECTION2.3 Multiple Objects on a Position-Time Graph (cont.) Step 1:Analyze the Problem Restate the questions. Question 1: At what time do A and B have the same position? Question 2: What is the position of runner A and runner B at this time?